Transcriptome (scRNA-seq data)
We show an example of scRNA-seq data produced by 10X Chromium. We are using scRNA-seq data 10k Human PBMCs, 3’ v3.1, Chromium Controller (11,485 cells and 36,601 genes) from 10X Genomics Datasets. The test data is directly available from Feature / cell matrix HDF5 (filtered) in here (registration required).
We use scanpy to read/write 10X data. Import numpy and scanpy in addlition to screcode.
[1]:
import screcode
import scanpy as sc
import warnings
warnings.simplefilter('ignore')
Read in the count matrix into an AnnData object.
[2]:
input_filename = 'data/10k_PBMC_3p_nextgem_Chromium_Controller_filtered_feature_bc_matrix.h5'
adata = sc.read_10x_h5(input_filename)
adata.layers["Raw"] = adata.X.toarray()
adata
[2]:
AnnData object with n_obs × n_vars = 11485 × 36601
    var: 'gene_ids', 'feature_types', 'genome'
    layers: 'Raw'
Apply RECODE
Apply RECODE to the count matrix. The anndata or ndarray data format is available.
[3]:
recode = screcode.RECODE()
adata = recode.fit_transform(adata)
start RECODE for scRNA-seq data
end RECODE for scRNA-seq
log: {'seq_target': 'RNA', '#significant genes': 12439, '#non-significant genes': 8969, '#silent genes': 11490, 'ell': 64, 'Elapsed time': '0h 0m 25s 024ms', 'solver': 'randomized', '#train_data': 2297}
With anndata format, outputs of RECODE are included in anndata objects:
denoised matrix -> adata.obsm[‘RECODE’]
noise variance -> adata.var[‘noise_variance_RECODE’]
normalized variance (NVSN variance) -> adata.var[‘normalized_variance_RECODE’]
clasification of genes (significant/non-significant/silent) -> adata.var[‘significance_RECODE’]
[4]:
adata
[4]:
AnnData object with n_obs × n_vars = 11485 × 36601
    var: 'gene_ids', 'feature_types', 'genome', 'noise_variance', 'normalized_variance', 'significance_RECODE'
    uns: 'RECODE_essential'
    layers: 'Raw', 'RECODE', 'RECODE_NVSN'
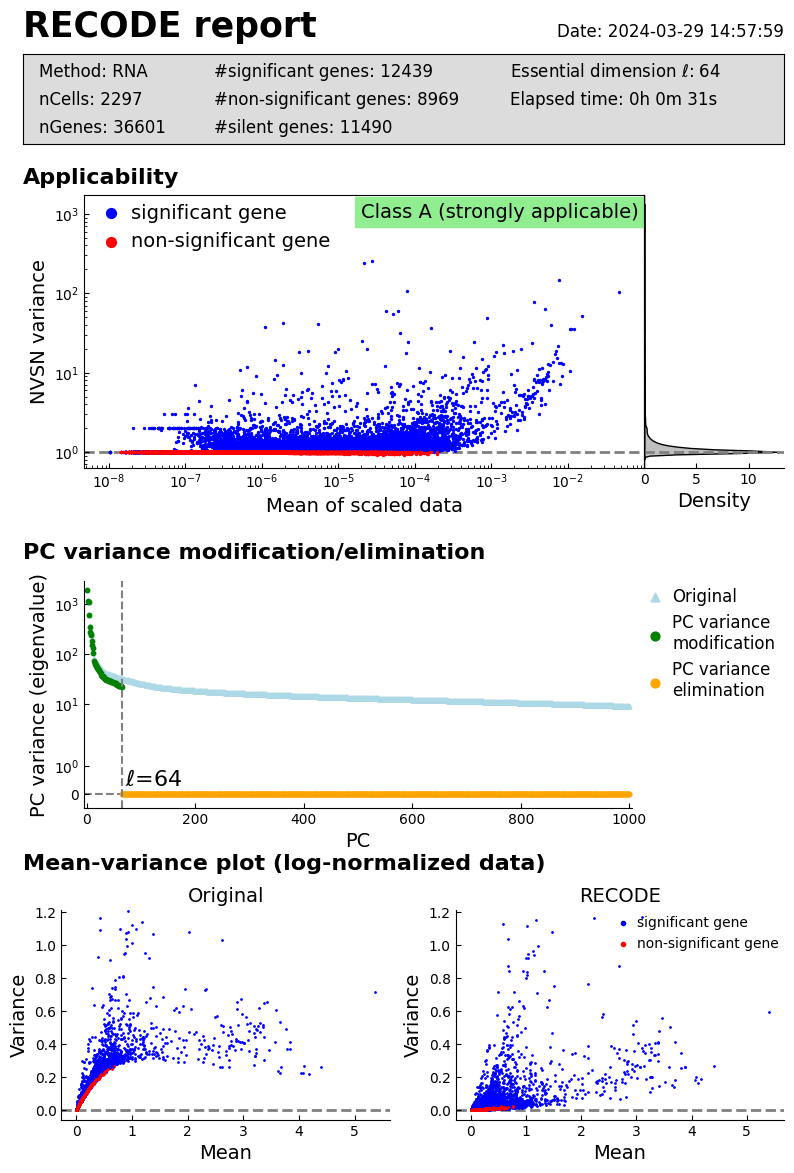
Performance check
[5]:
recode.report()
Downstream analysis based on scanpy
log normalization
[6]:
target_sum = 1e4
adata = recode.lognormalize(adata,target_sum=target_sum)
Normalized data are stored in "RECODE_norm" and "RECODE_log"
[7]:
adata.X = adata.layers["RECODE_log"]
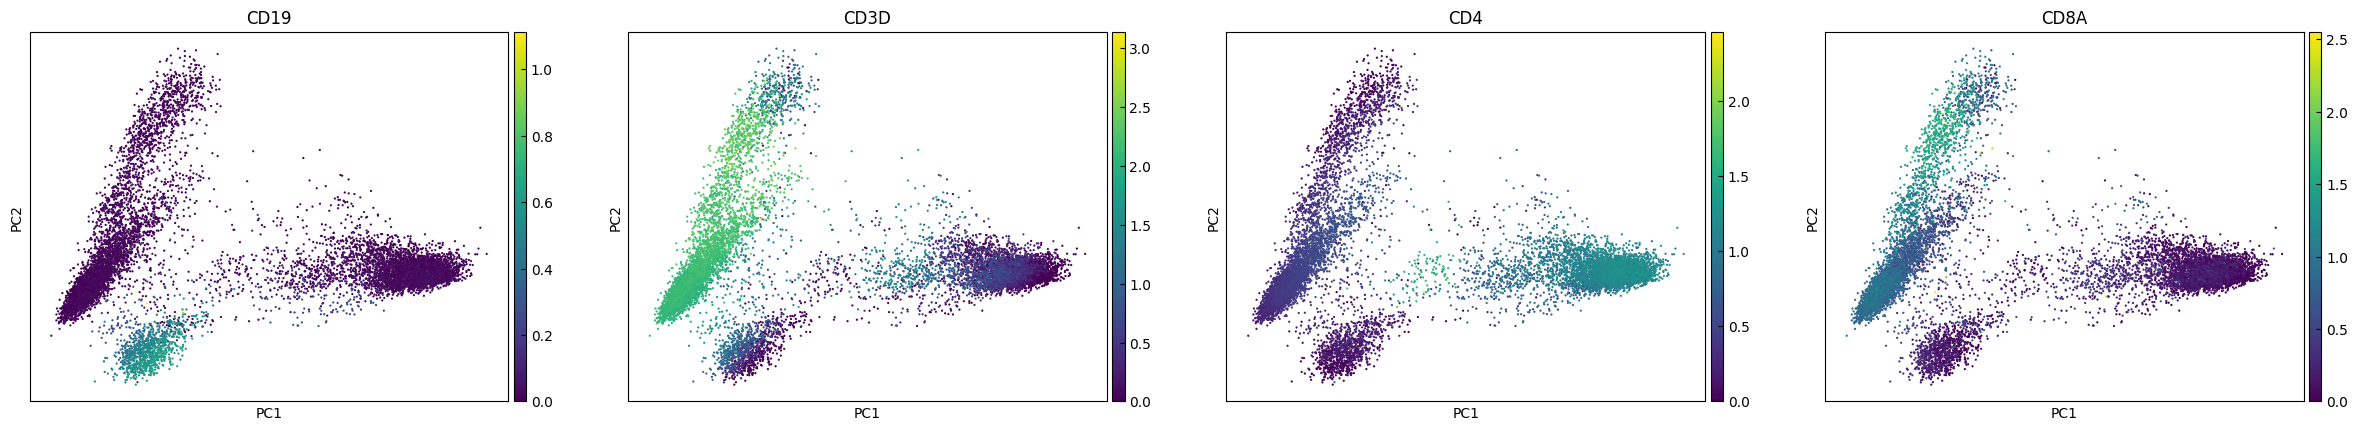
PCA
[8]:
sc.tl.pca(adata, svd_solver='arpack')
[9]:
plot_genes = ['CD19','CD3D','CD4','CD8A']
sc.pl.pca(adata, color=plot_genes)
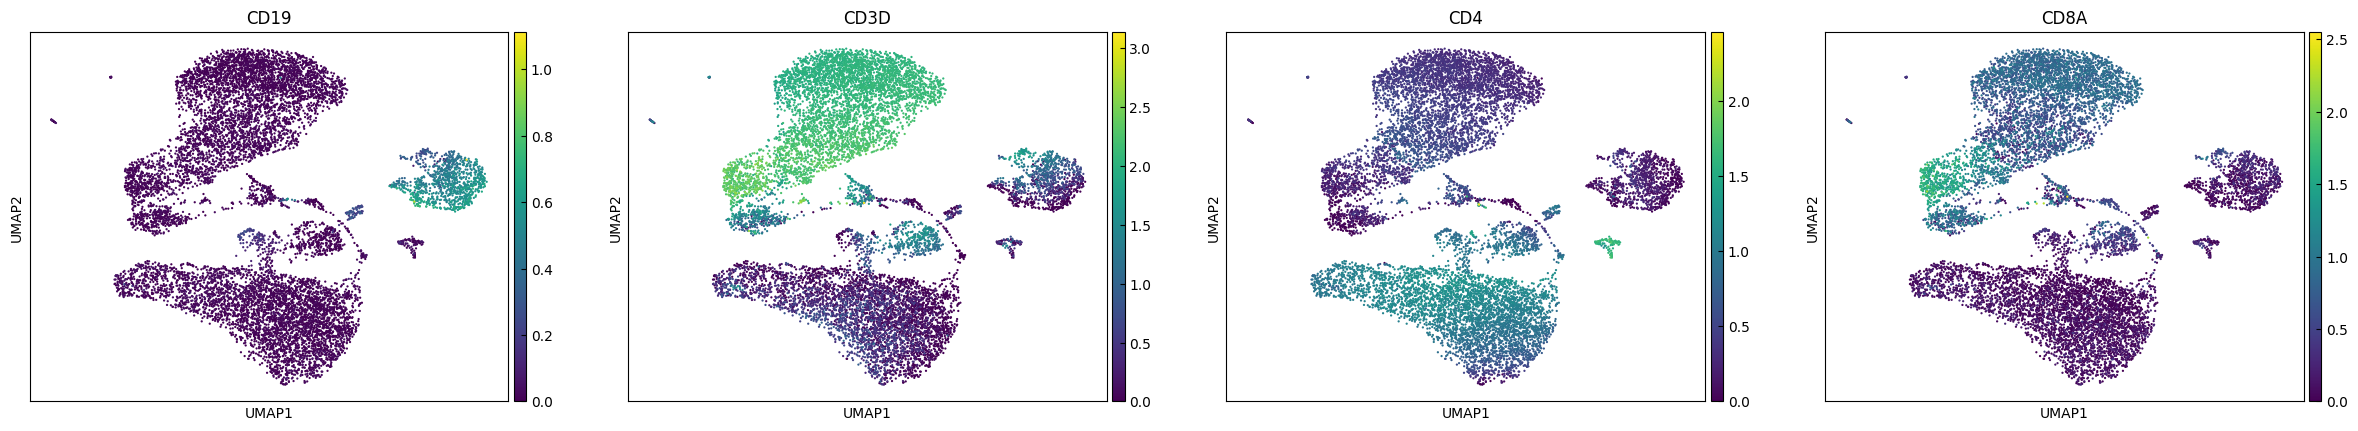
UMAP
Note that we do not use the PCA dimentionaly reduction as a preprocessing of UMAP (n_pca=0).
[10]:
sc.pp.neighbors(adata, n_neighbors=10, n_pcs=0)
sc.tl.umap(adata)
[11]:
sc.pl.umap(adata, color=plot_genes)
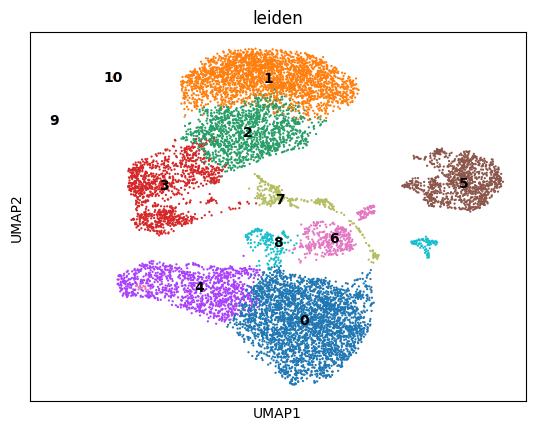
Clustering
[12]:
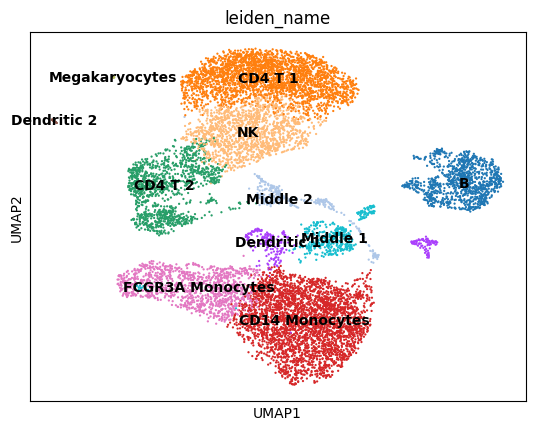
sc.tl.leiden(adata,resolution=0.3)
sc.pl.umap(adata, color=['leiden'],legend_loc='on data')
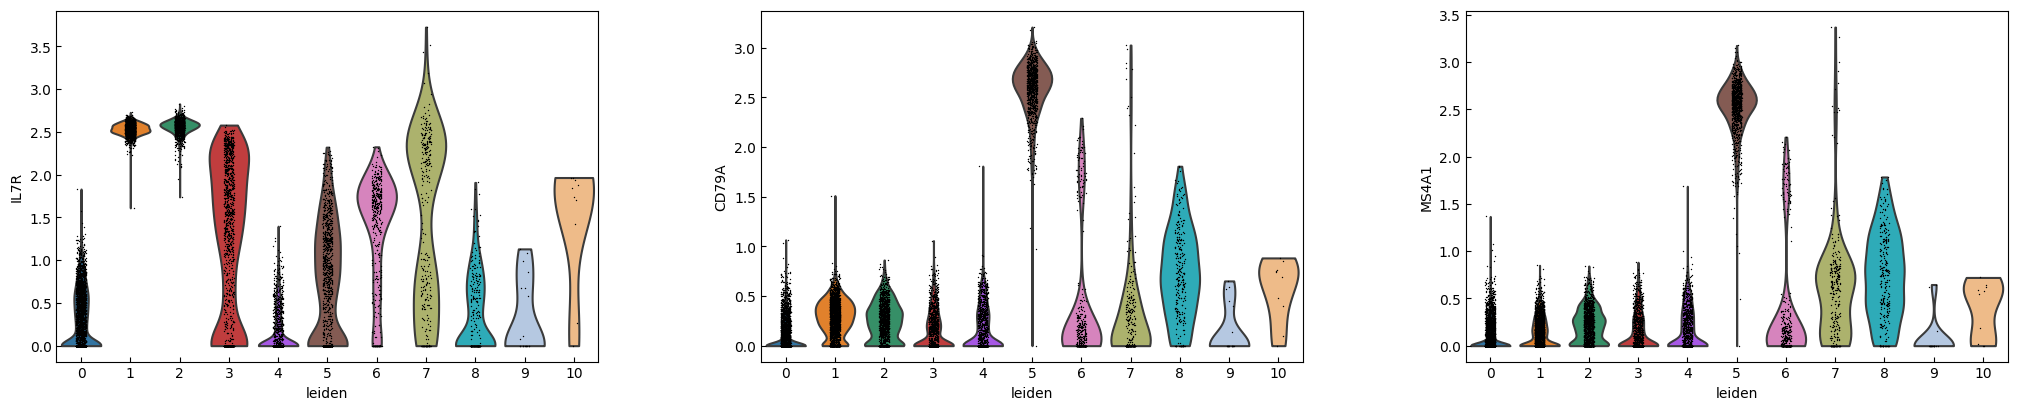
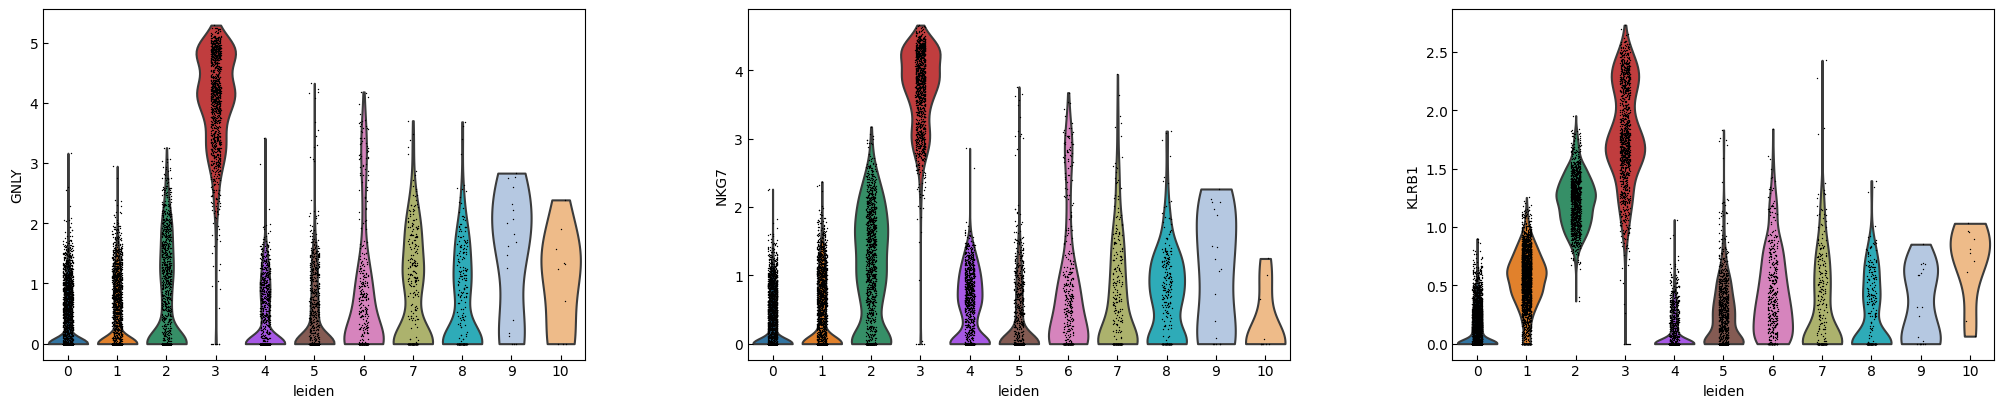
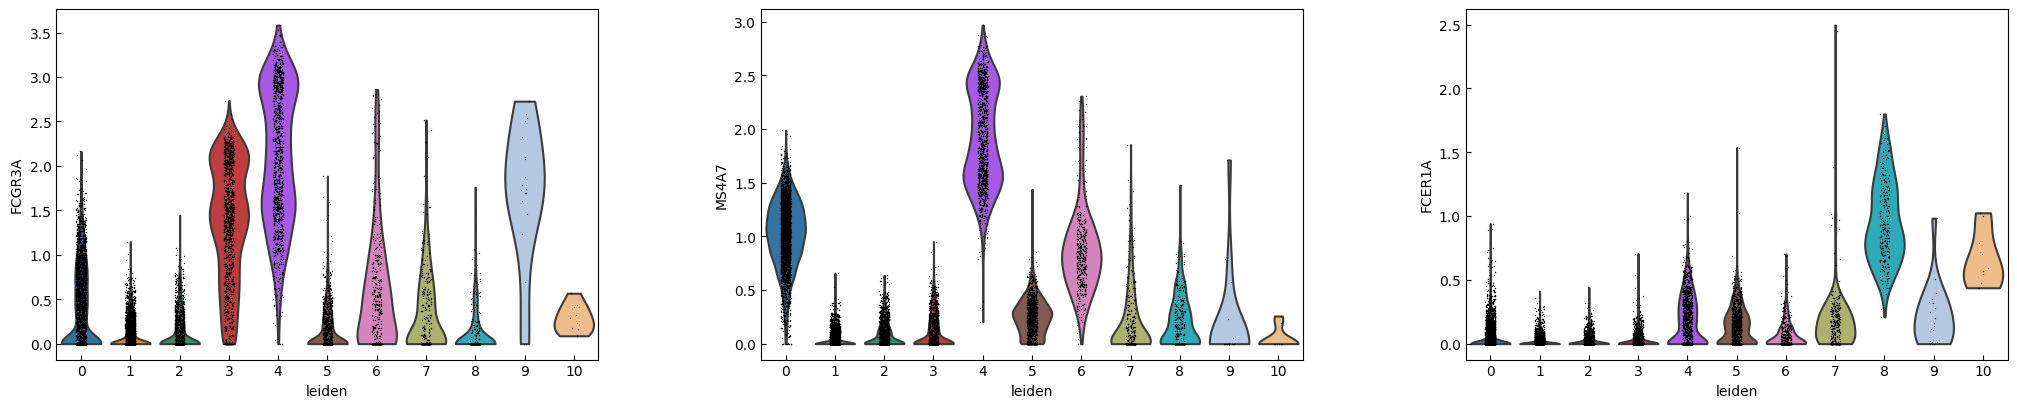
Find marker genes
[13]:
import numpy as np
threshold_mean = 0.5
adata_marker = adata[:,np.mean(adata.X,axis=0)>threshold_mean]
sc.tl.rank_genes_groups(adata_marker, 'leiden', method='t-test')
[14]:
marker_genes = list(adata_marker.uns['rank_genes_groups']['names'][0]) # The top marker genes for each cluster
[15]:
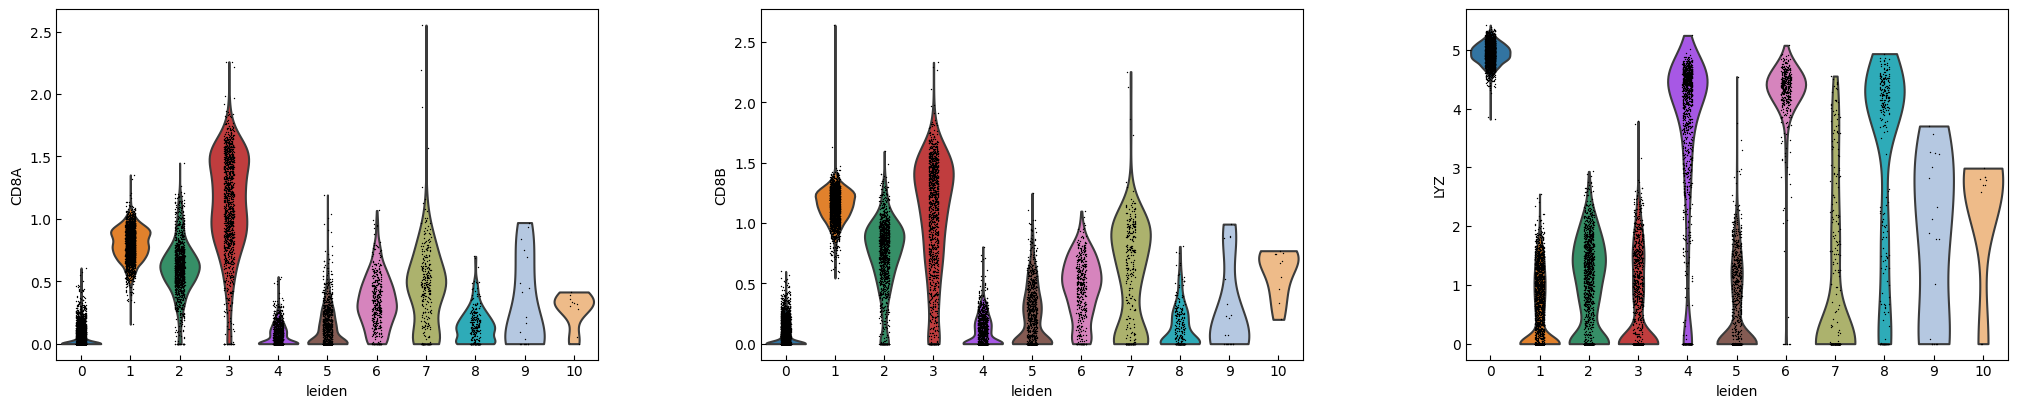
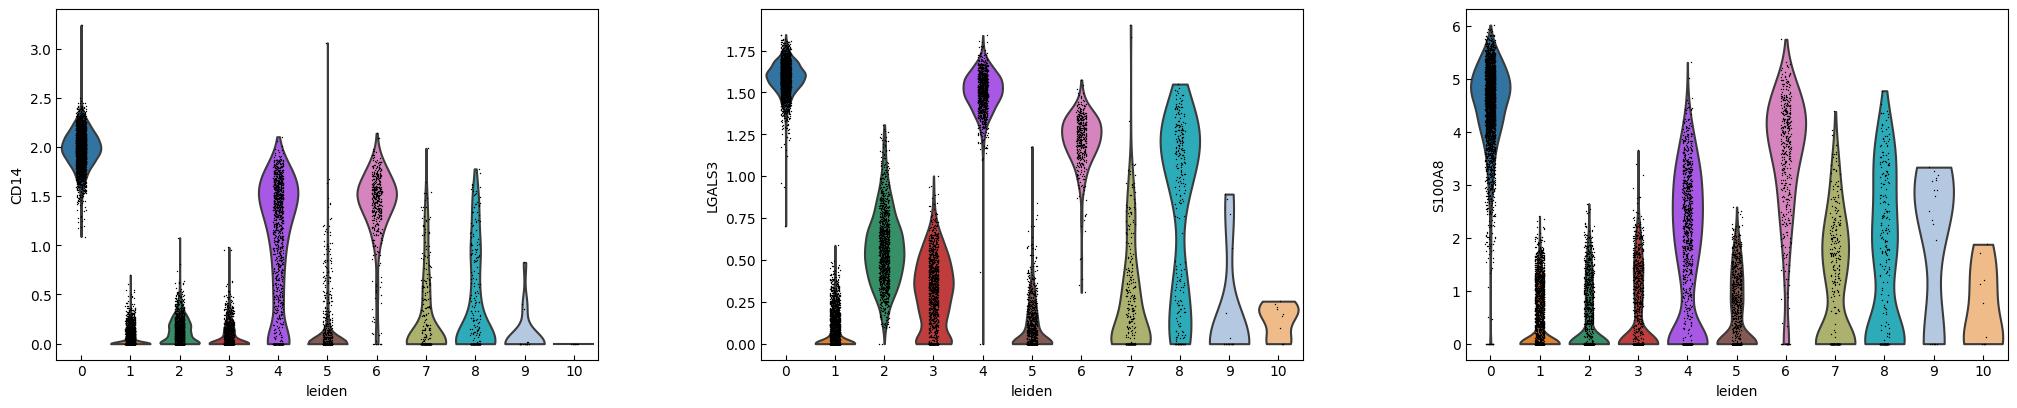
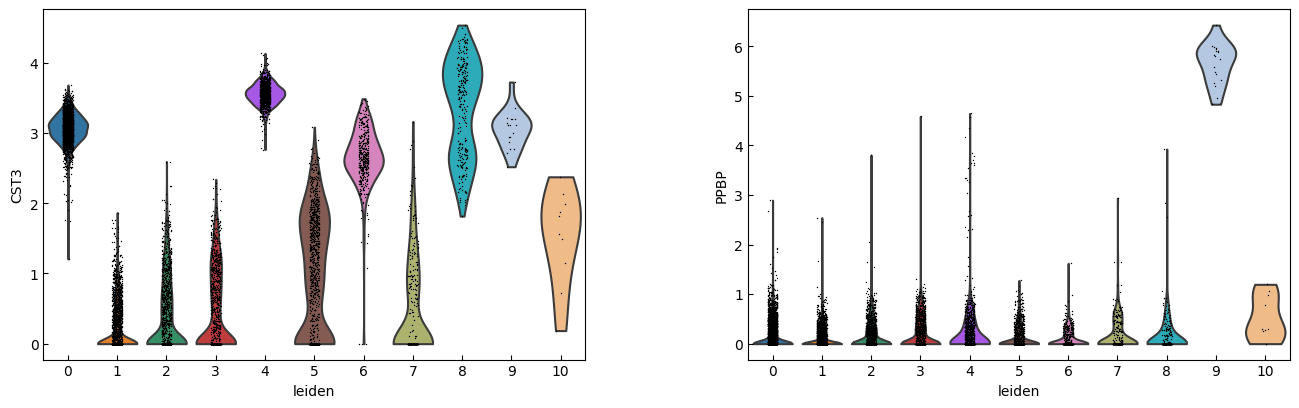
marker_genes = ['IL7R', 'CD79A', 'MS4A1', 'CD8A', 'CD8B', 'LYZ', 'CD14',
                'LGALS3', 'S100A8', 'GNLY', 'NKG7', 'KLRB1',
                'FCGR3A', 'MS4A7', 'FCER1A', 'CST3', 'PPBP']
adata.var_names_make_unique()
n_cols = 3
for i in range(0, len(marker_genes),n_cols):
    sc.pl.violin(adata, marker_genes[i:i+n_cols], groupby='leiden')
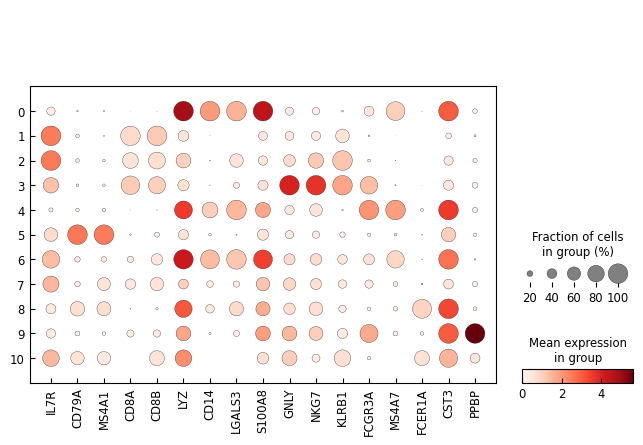
[16]:
sc.pl.dotplot(adata, marker_genes, groupby='leiden',expression_cutoff=0.5)
[17]:
new_cluster_names = [
    'CD14 Monocytes','CD4 T 1', 'NK', 'CD4 T 2','FCGR3A Monocytes',
    'B', 'Middle 1', 'Middle 2', 'Dendritic 1', 'Dendritic 2', 'Dendritic 3', 'Megakaryocytes']
adata.obs["leiden_name"] = [new_cluster_names[int(i)] for i in adata.obs["leiden"].values]
sc.pl.umap(adata, color='leiden_name', legend_loc='on data')
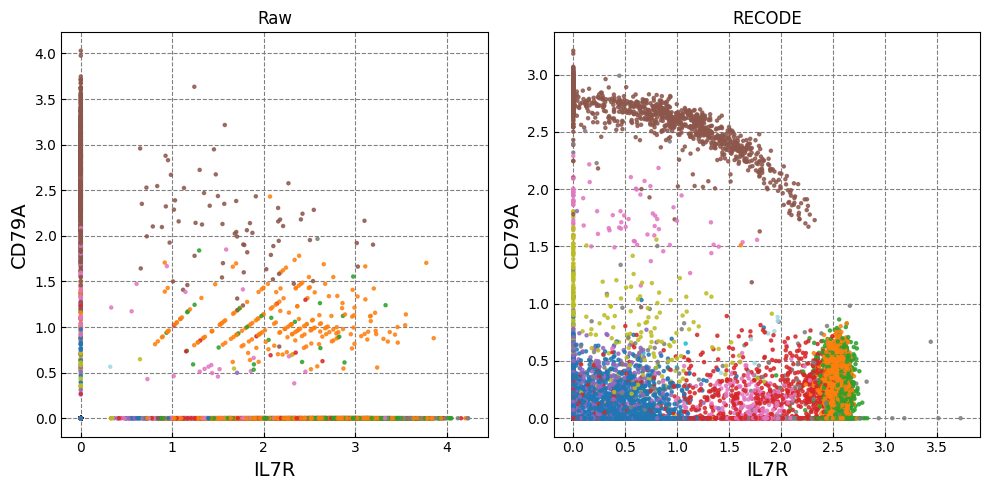
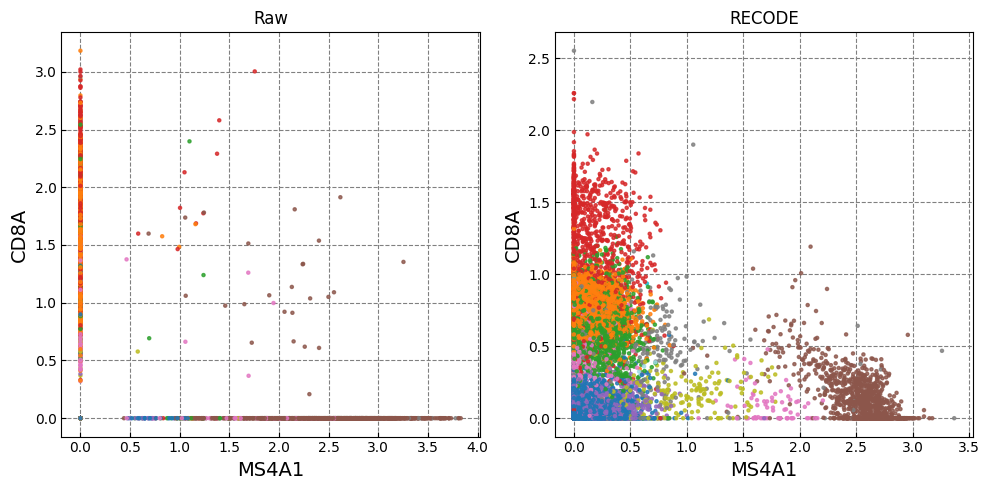
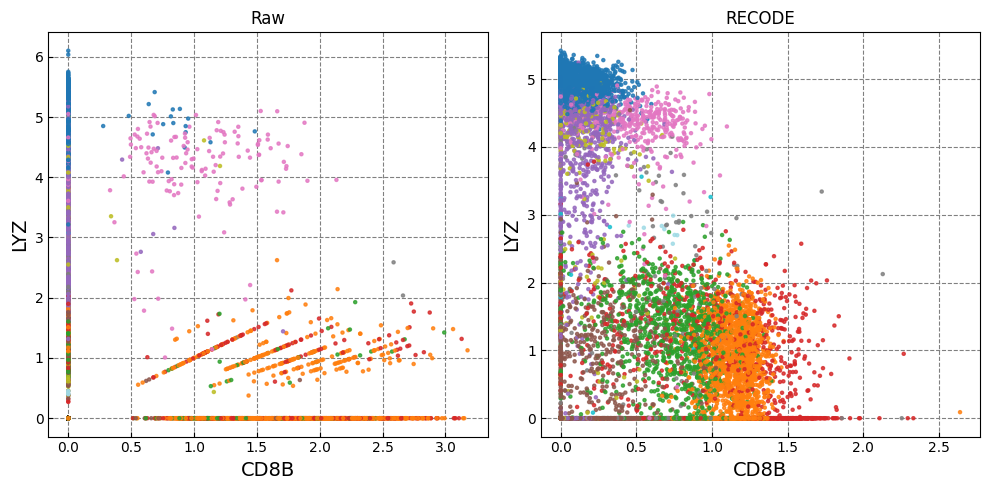
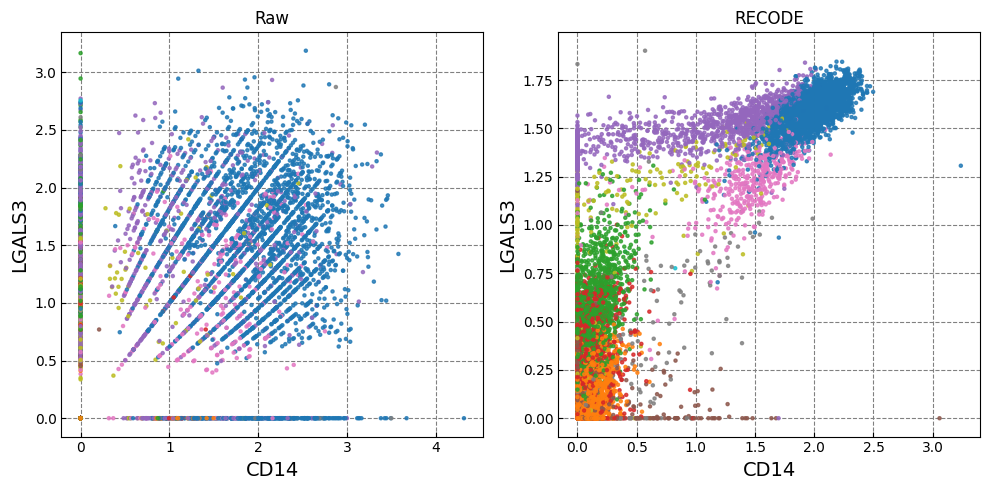
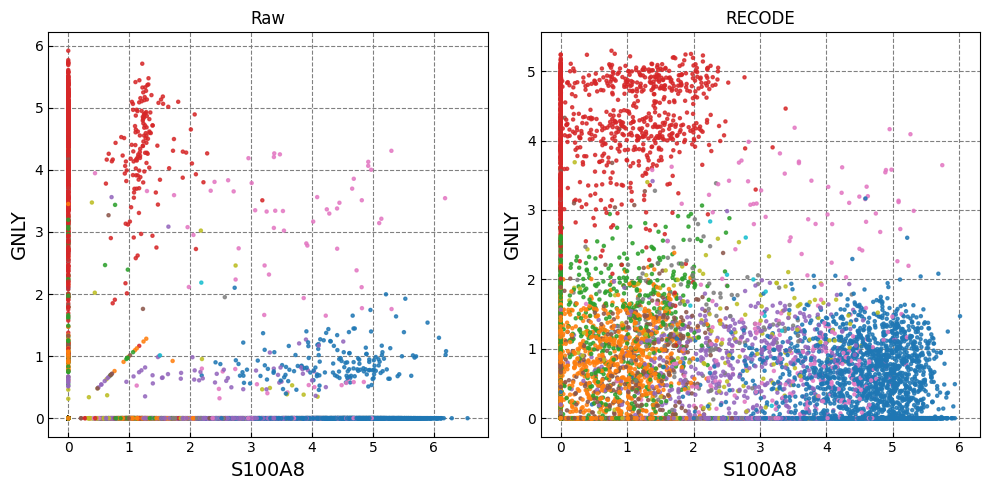
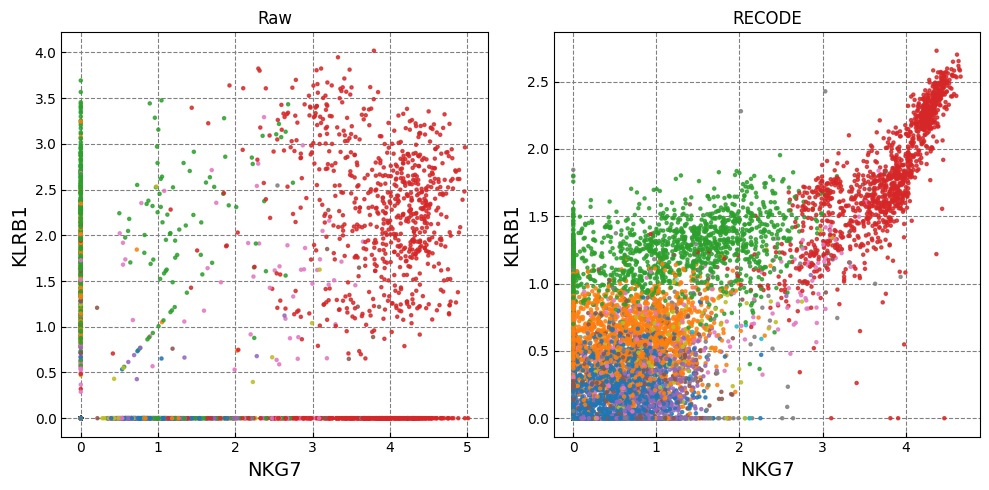
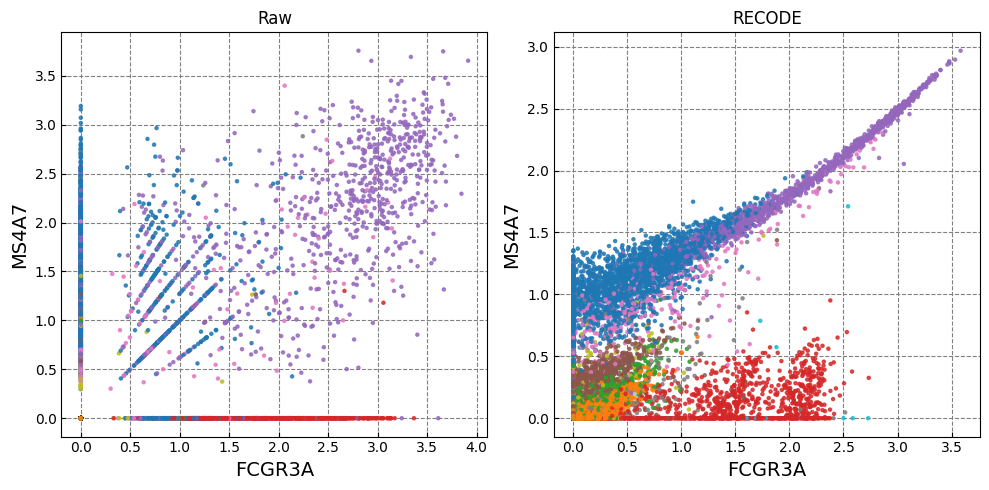
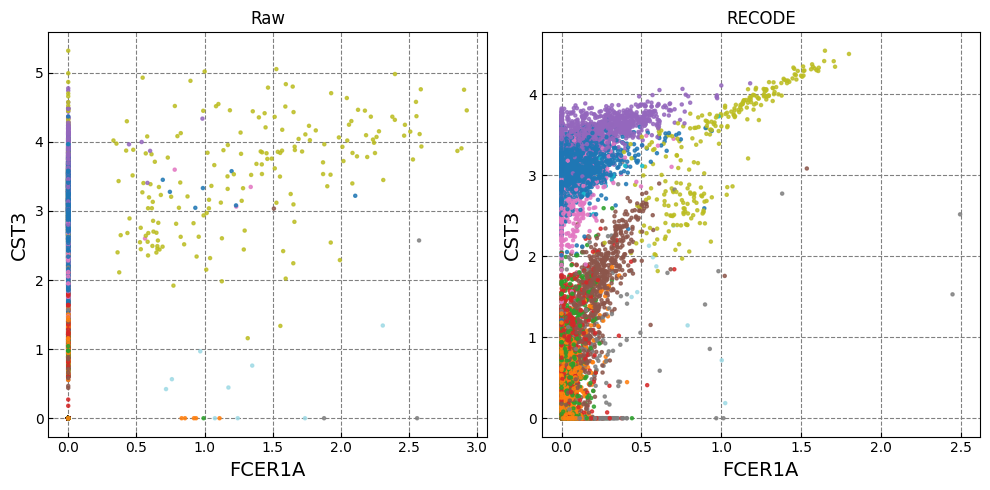
Gene expression distributions
[18]:
import matplotlib.pyplot as plt

size_factor = 1e4
alpha = 0.8
ps = 5
fontsize_label = 14
adata = recode.lognormalize(adata,target_sum=target_sum,key="Raw")
plot_data = [adata.layers["Raw_log"],adata.X]
names = ['Raw','RECODE']
color = np.array(adata.obs['leiden'].values,dtype=int)

n_col_genes = 1

n_plot = len(names)
n_ax =  n_plot * n_col_genes
for k in range(0, len(marker_genes),2):
    if k+1 >= len(marker_genes): break
    fig,ax = plt.subplots(1,n_ax,figsize=(5*n_ax,5),tight_layout=True)
    for i in range(n_plot):
        i_ax = i
        g1_,g2_ = marker_genes[k],marker_genes[k+1]
        ax[i_ax].scatter(plot_data[i][:,adata.var.index==g1_], plot_data[i][:,adata.var.index==g2_], c=color, alpha=alpha,zorder=10,s=ps,cmap='tab20')
        ax[i_ax].set_xlabel(g1_,fontsize=fontsize_label)
        ax[i_ax].set_ylabel(g2_,fontsize=fontsize_label)
        ax[i_ax].set_title(names[i])
        ax[i_ax].grid(ls='--',color='gray',zorder=0)
Normalized data are stored in "Raw_norm" and "Raw_log"
[ ]:
import scipy
import adjustText
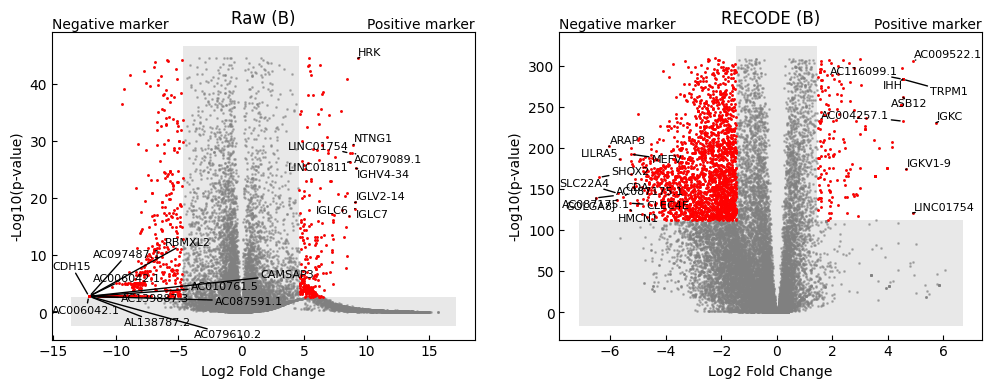
def volcano_plot(
target_cluster,
clusters = adata.obs["leiden_name"],
data_key = ["Raw","RECODE"],
figsize=(6,4),
to_pt_FC = 80,
to_pt_pval = 75,
n_genes = 10,
fs_genes = 8,
):
fig,ax = plt.subplots(1,2,figsize=(figsize[0]*len(data_key),figsize[1]))
for i in range(len(data_key)):
key = data_key[i]
idx_target = clusters == target_cluster
idx_others = clusters != target_cluster
# data_FC = adata.layers[key+"_norm"]
data_FC = adata.layers[key+"_log"]
g1_mean_ = np.mean(data_FC[idx_target],axis=0)
g2_mean_ = np.mean(data_FC[idx_others],axis=0)
g1_mean_[g1_mean_ == 0] = 1
g2_mean_[g2_mean_ == 0] = 1
FC = np.log2(g1_mean_ / g2_mean_)
data_pval = adata.layers[key+"_log"]
pvalue = scipy.stats.ttest_ind(data_pval[idx_target], data_pval[idx_others])[1]
pvalue_log = -np.log10(pvalue)
pvalue_log_max = np.max(pvalue_log[(np.isinf(pvalue_log)==False) & (np.isnan(pvalue_log)==False)])*1.05
pvalue_log_plot =np.copy(pvalue_log)
pvalue_log_plot[np.isinf(pvalue_log)] = pvalue_log_max
ax_ = ax[i]
to_FC = np.percentile(np.abs(FC),to_pt_FC)
to_pval = np.percentile(pvalue_log[(np.isnan(pvalue_log)==False) & (np.isinf(pvalue_log)==False)],to_pt_pval)
ax_.scatter(FC,pvalue_log,s=1,color="gray",alpha=0.5)
idx_ = (pvalue_log>to_pval) & (np.abs(FC)>to_FC) & (np.isnan(pvalue_log)==False) & (np.isinf(pvalue_log)==False)
ax_.scatter(FC[idx_], pvalue_log[idx_], color="red", s=1)
ax_.fill_between(
[-to_FC, to_FC],
to_pval,
ax_.get_ylim()[1],
facecolor="lightgray",
alpha=0.5,
zorder=0,
)
ax_.fill_between(
[ax_.get_xlim()[0], ax_.get_xlim()[1]],
ax_.get_ylim()[0],
to_pval,
facecolor="lightgray",
alpha=0.5,
zorder=0,
)
idx_ = (pvalue_log>to_pval) & (np.isnan(pvalue_log)==False) & (np.isinf(pvalue_log)==False)
idx_mgenes = np.argsort(FC[idx_])
texts = []
for j in range(n_genes):
text_ = ax_.text(
FC[idx_][idx_mgenes][j],
pvalue_log[idx_][idx_mgenes][j],
adata.var.index[idx_][idx_mgenes][j],
color="k",
fontsize=fs_genes,
)
texts = np.append(texts, text_)
text_ = ax_.text(
FC[idx_][idx_mgenes][-j],
pvalue_log[idx_][idx_mgenes][-j],
adata.var.index[idx_][idx_mgenes][-j],
color="k",
fontsize=fs_genes,
)
texts = np.append(texts, text_)
# adjustText.adjust_text(texts, arrowprops=dict(arrowstyle='-', color='k'),ax=ax_)
ax_.set_title("%s (%s)" % (key,target_cluster))
ax_.set_xlabel('Log2 Fold Change')
ax_.set_ylabel('-Log10(p-value)')
ax_.text(1,1,"Positive marker", ha='right', va='bottom',transform=ax_.transAxes)
ax_.text(0,1,"Negative marker", ha='left', va='bottom',transform=ax_.transAxes)
volcano_plot(target_cluster = "B")