Spatial transcriptome (Xenium)
We demonstrate a noise reduction with RECODE for spatial transcriptome data (FISH based). We use spatial transcriptome data of Xenium 10X, FFPE Human Pancreatic Ductal Adenocarcinoma Data with Human Immuno-Oncology Profiling Panel. The dataset is available from 10X datasets.
We use scanpy to read/write data. Import numpy and scanpy in addlition to screcode.
[1]:
import scanpy as sc
import numpy as np
import screcode
import warnings
warnings.simplefilter('ignore')
import matplotlib.pyplot as plt
import pandas as pd
Read in the count matrix into an AnnData object.
[2]:
INPUT_DIR = 'data/Xenium_V1_Human_Ductal_Adenocarcinoma_FFPE_outs'
INPUT_FILE = "cell_feature_matrix.h5"
Raw_key = "count"
adata = sc.read_10x_h5("%s/%s" % (INPUT_DIR,INPUT_FILE))
adata.obs = pd.read_csv("%s/cells.csv.gz" % INPUT_DIR)
adata.var_names_make_unique()
adata = adata[:,np.sum(adata.X,axis=0)>0]
adata = adata[np.sum(adata.X,axis=1)>0]
adata.layers["Raw"] = adata.X.toarray()
adata
[2]:
AnnData object with n_obs × n_vars = 234857 × 380
    obs: 'cell_id', 'x_centroid', 'y_centroid', 'transcript_counts', 'control_probe_counts', 'control_codeword_counts', 'unassigned_codeword_counts', 'deprecated_codeword_counts', 'total_counts', 'cell_area', 'nucleus_area'
    var: 'gene_ids', 'feature_types', 'genome'
    layers: 'Raw'
Apply RECODE
Apply RECODE to the count matrix (without using spatial coordinates).
[3]:
import screcode
recode = screcode.RECODE(seq_target='RNA',version=2)
adata = recode.fit_transform(adata)
start RECODE for scRNA-seq data
end RECODE for scRNA-seq
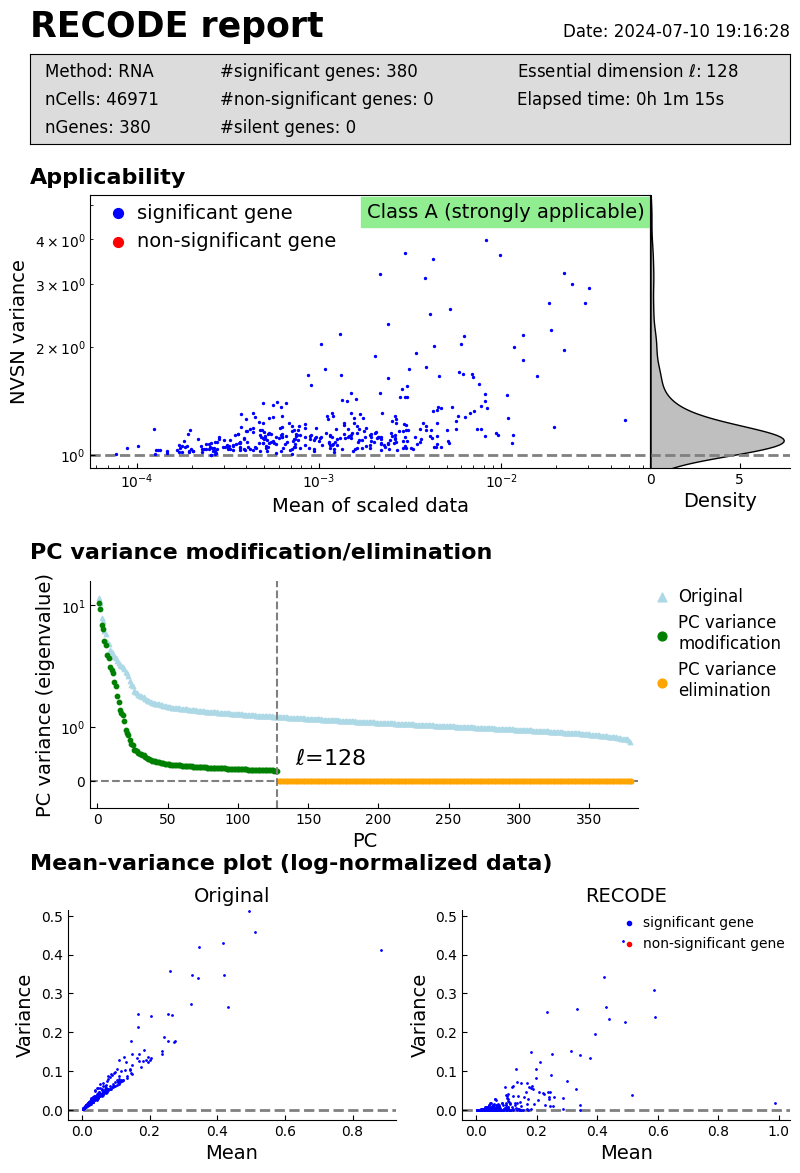
log: {'seq_target': 'RNA', '#significant genes': 380, '#non-significant genes': 0, '#silent genes': 0, 'ell': 128, 'Elapsed time': '0h 0m 9s 624ms', 'solver': 'randomized', '#train_data': 46971}
Performance check
[4]:
recode.report()
Log normalizaation
[5]:
target_sum = np.median(np.sum(adata.layers["RECODE"],axis=1))
adata = recode.lognormalize(adata,target_sum=target_sum)
print(np.median(np.sum(adata.layers["RECODE"],axis=1)))
Normalized data are stored in "RECODE_norm" and "RECODE_log"
46.68504
[6]:
adata.layers["Raw_norm"] = target_sum*adata.layers["Raw"]/np.sum(adata.layers["Raw"],axis=1)[:,np.newaxis]
adata.layers["Raw_log"] = np.log(adata.layers["Raw_norm"]+1)
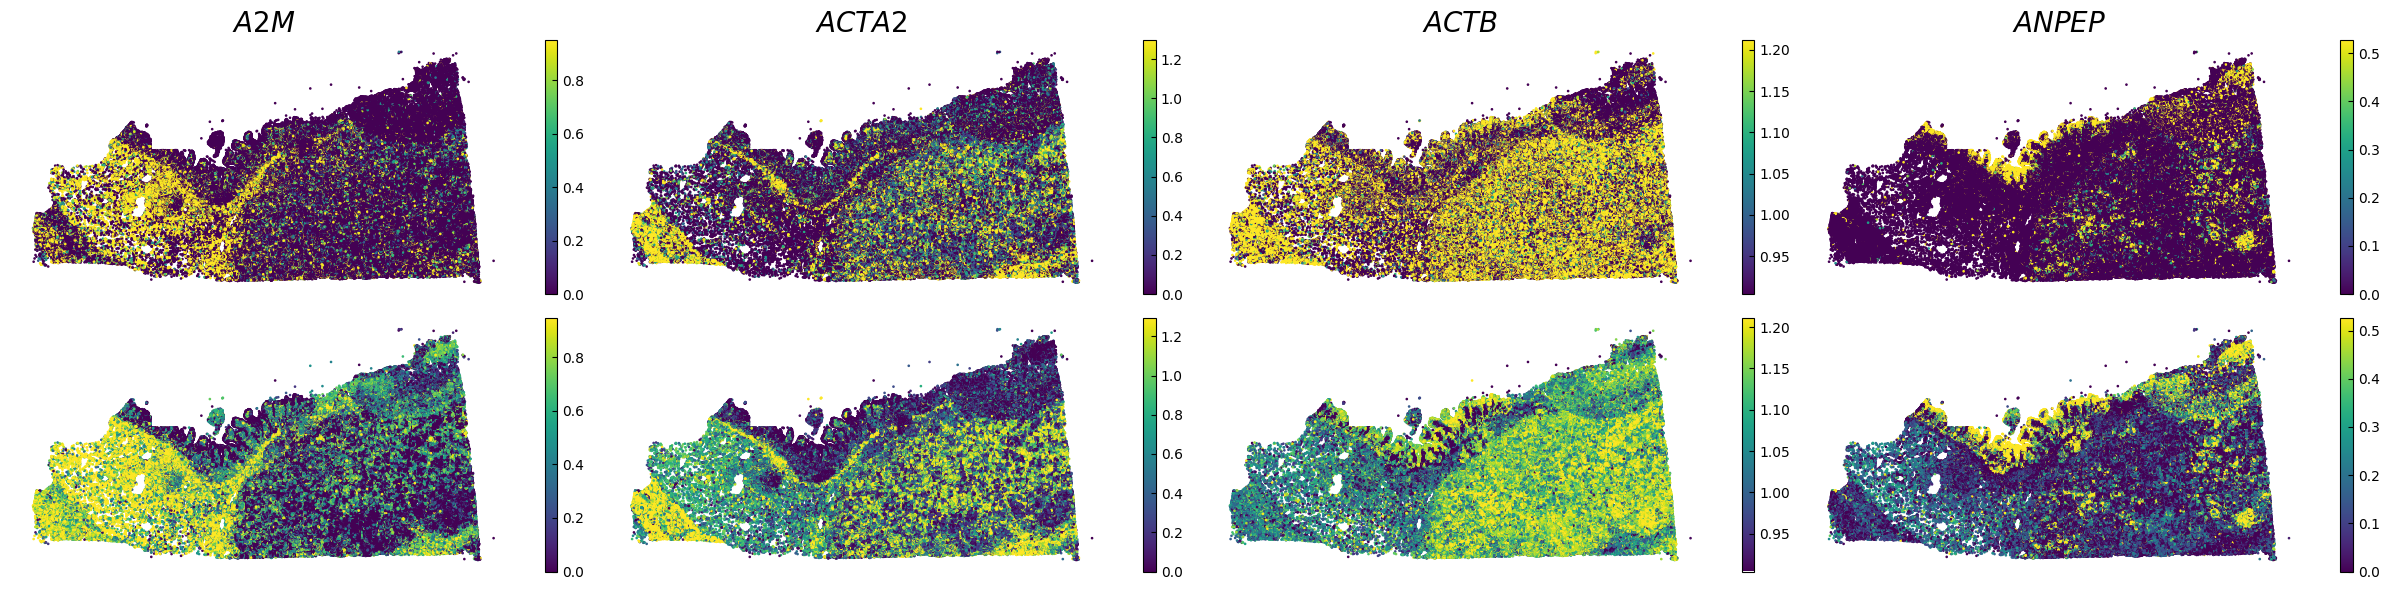
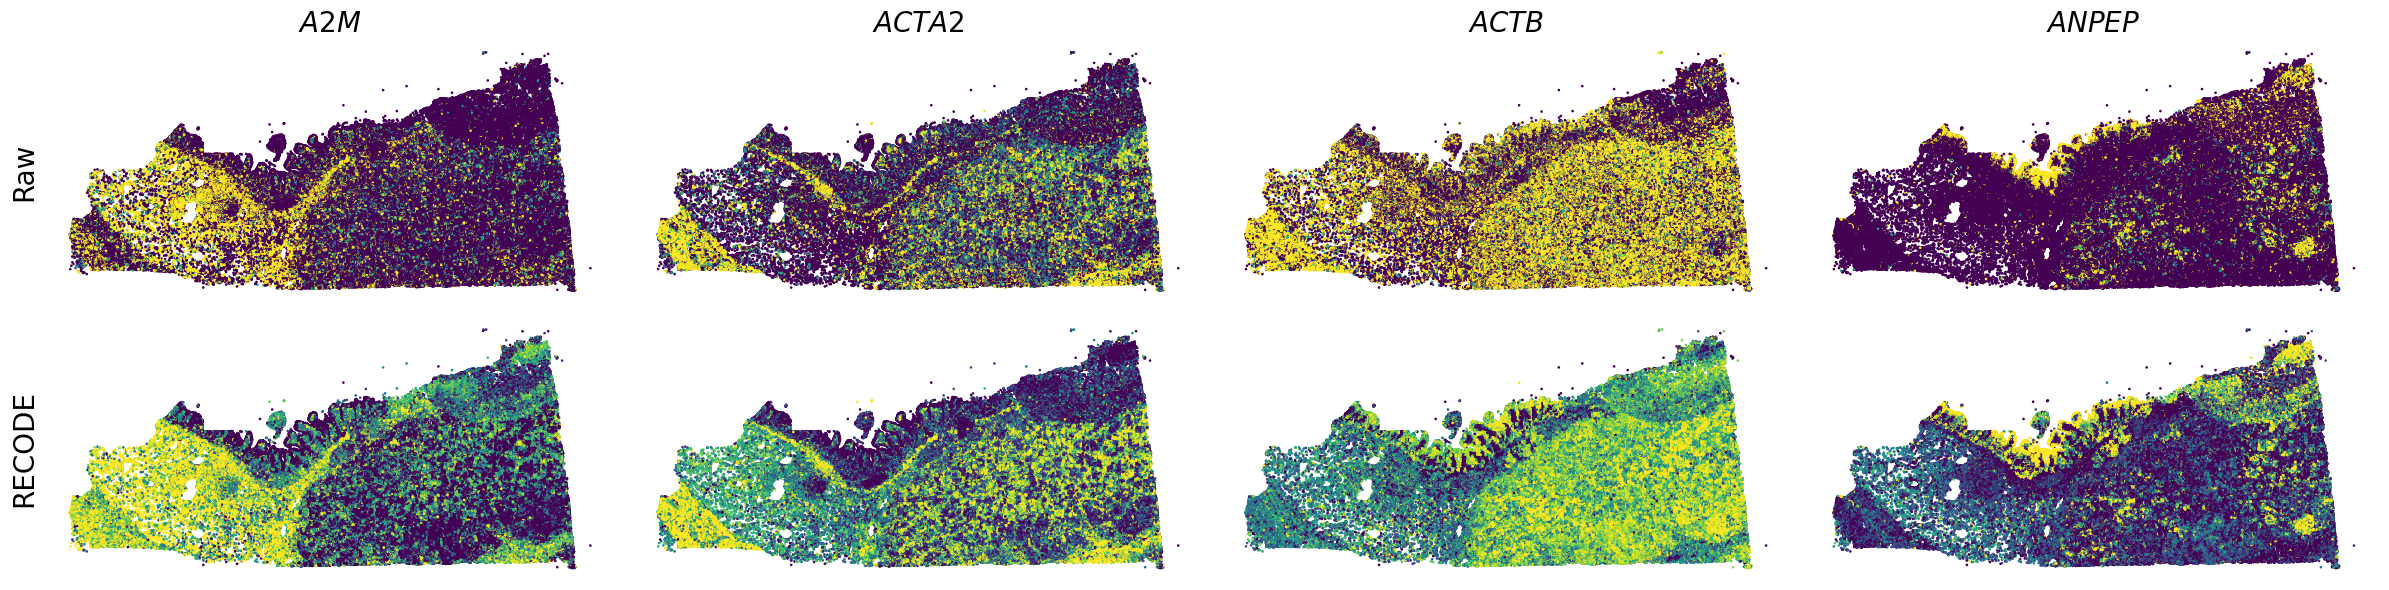
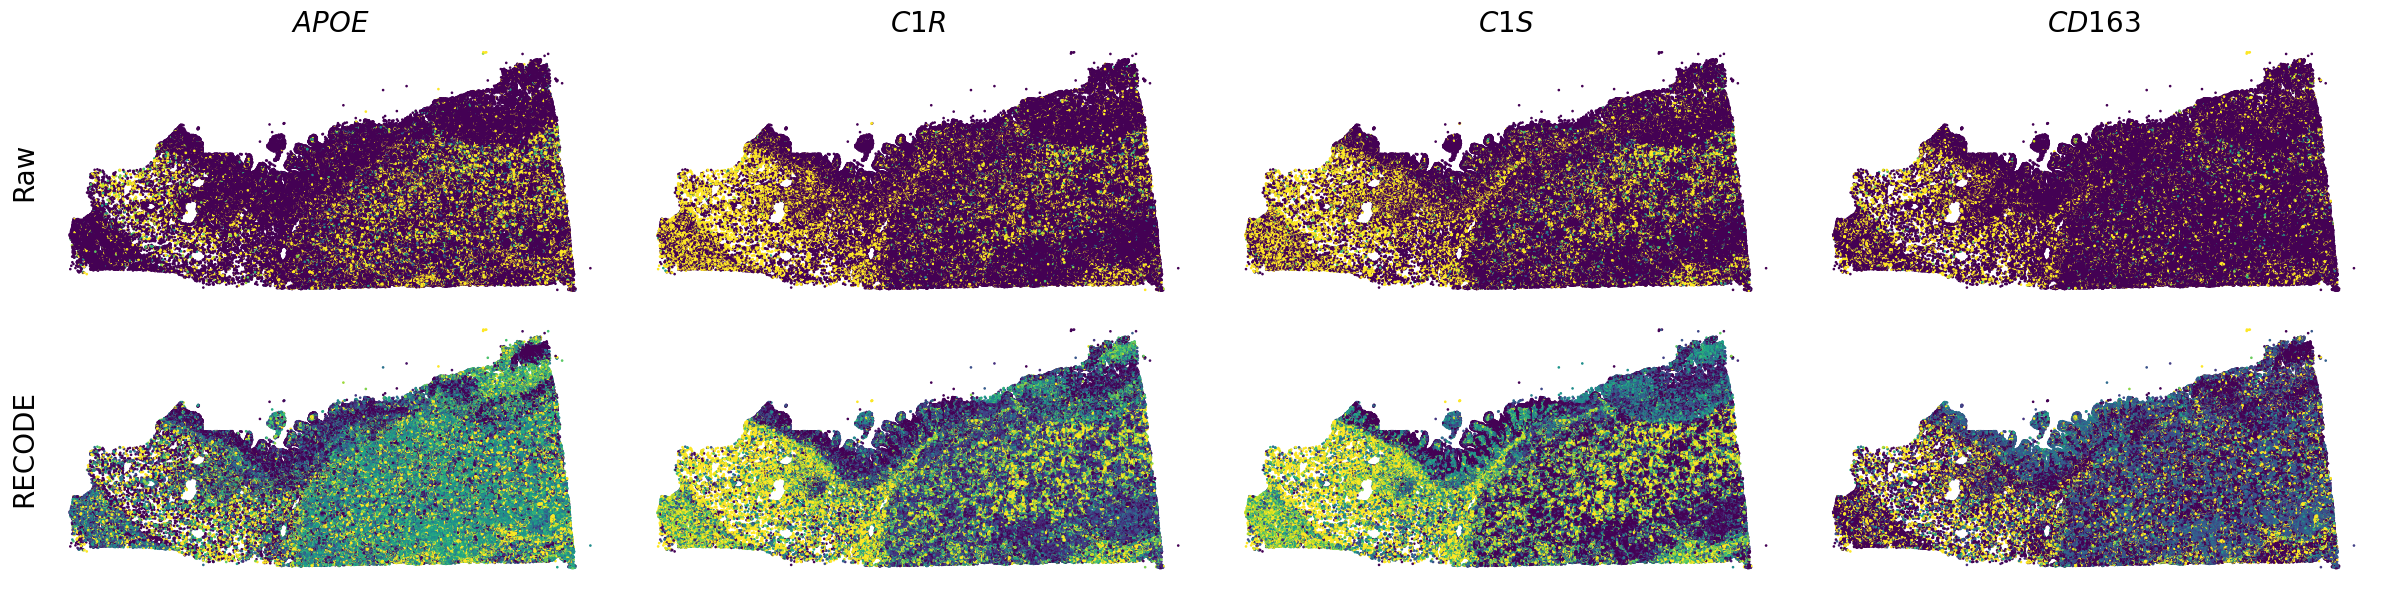
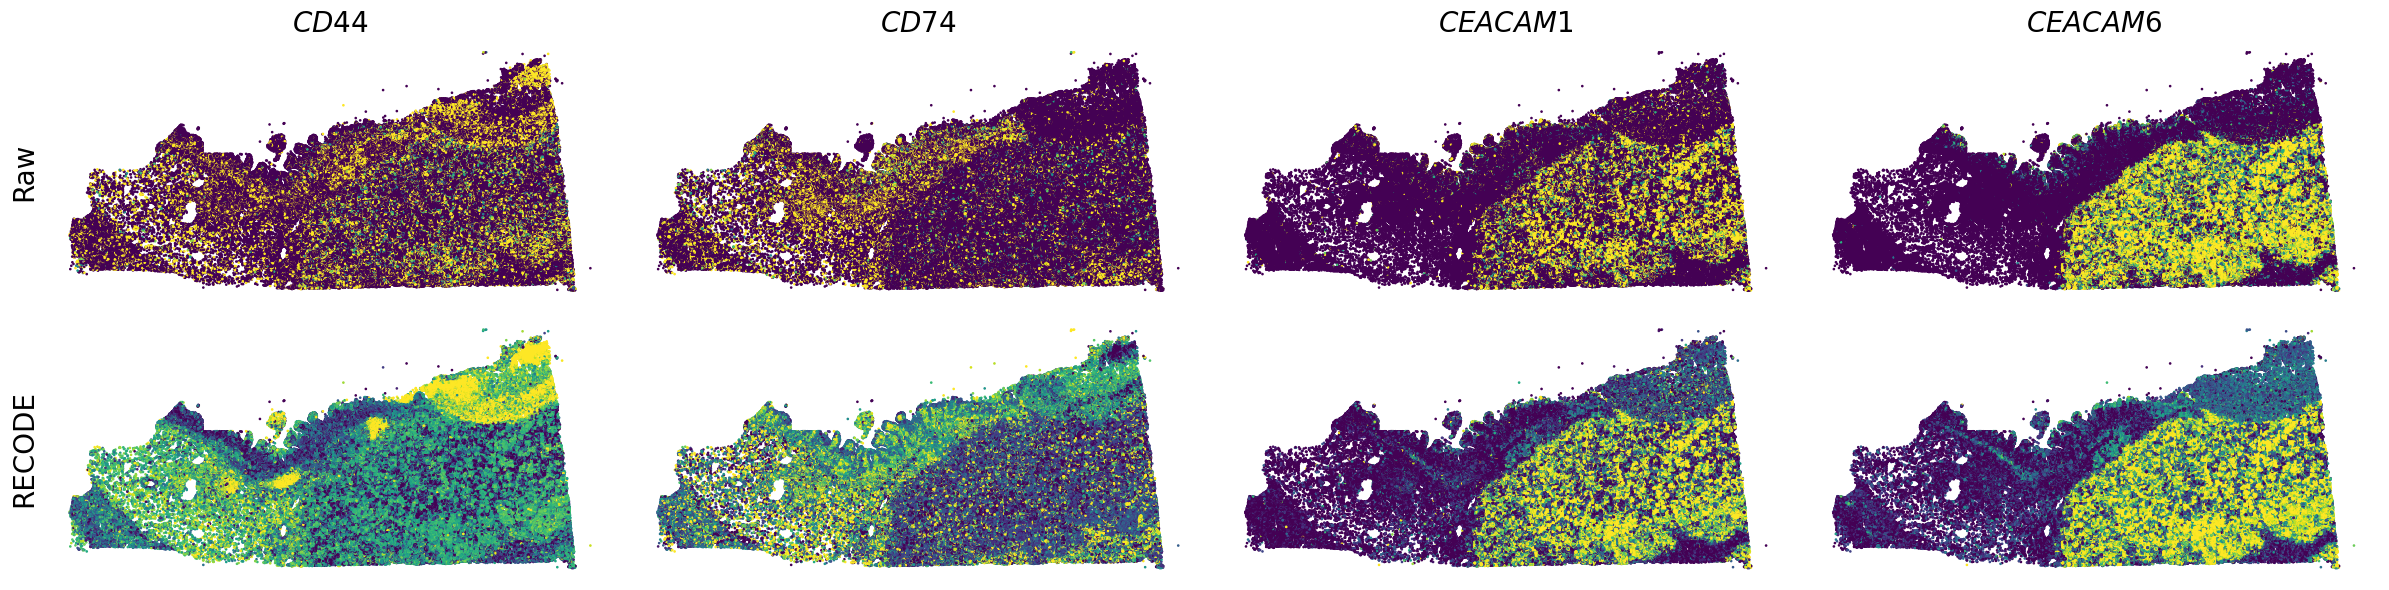
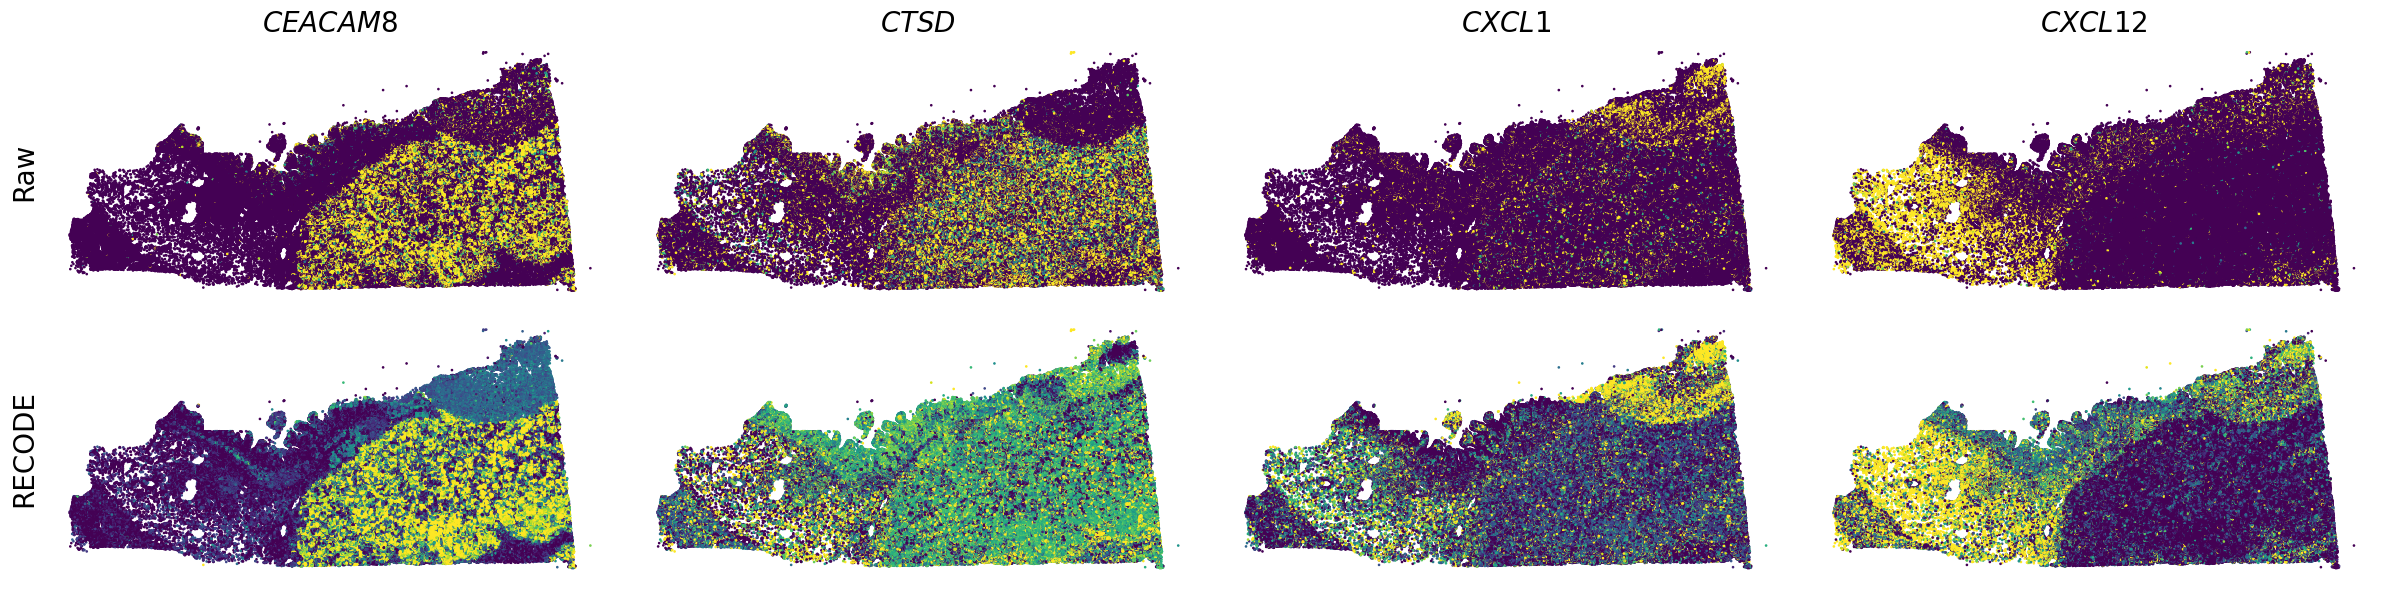
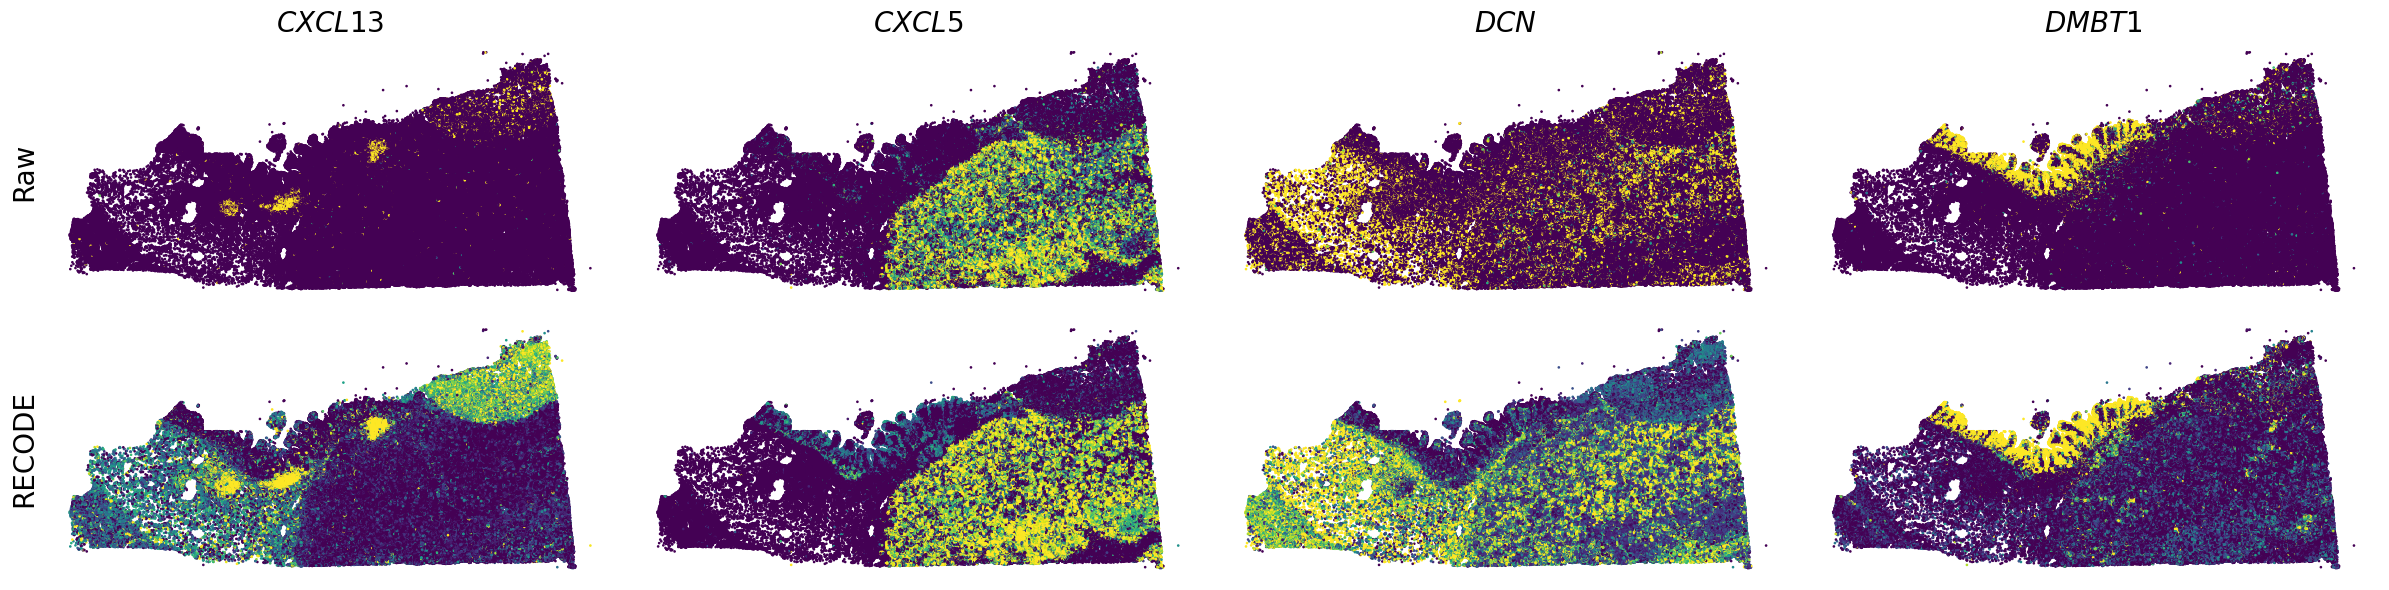
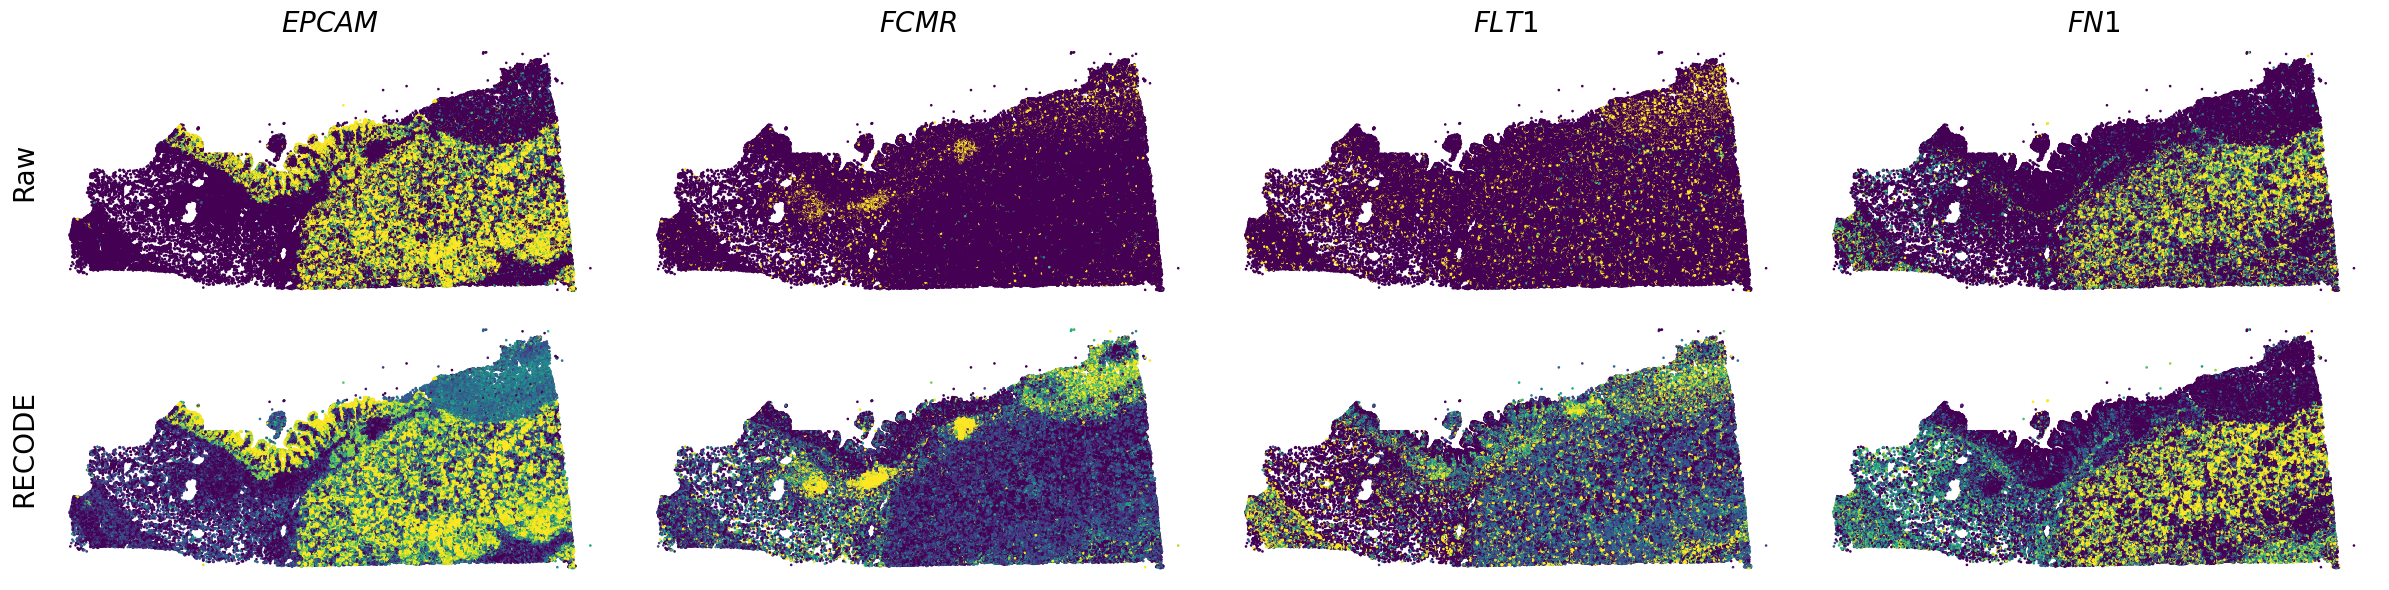
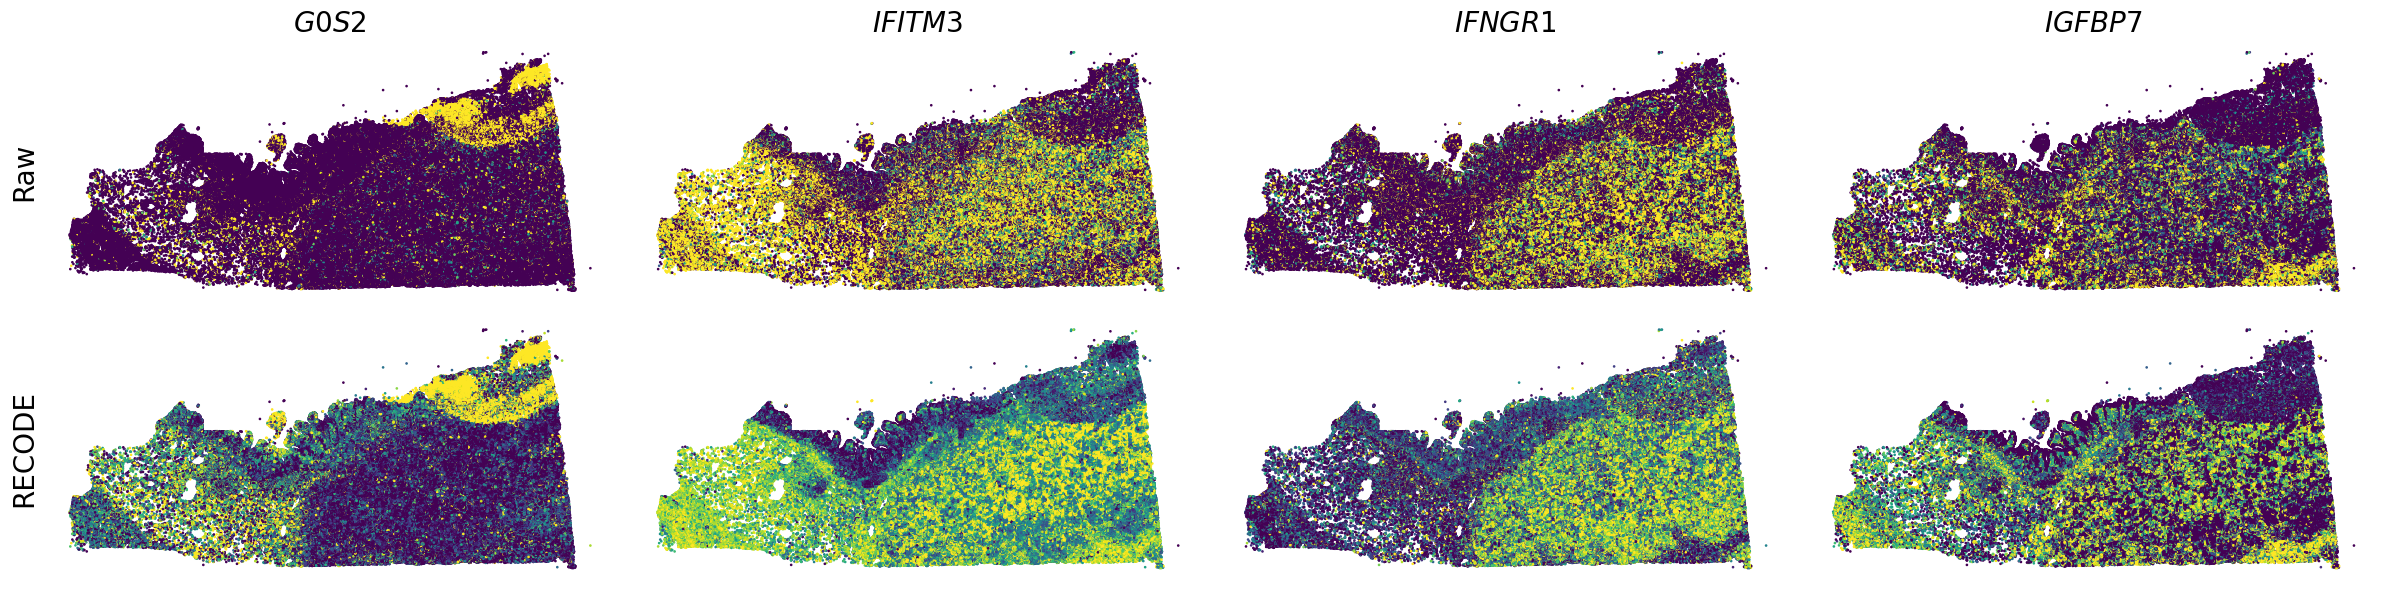
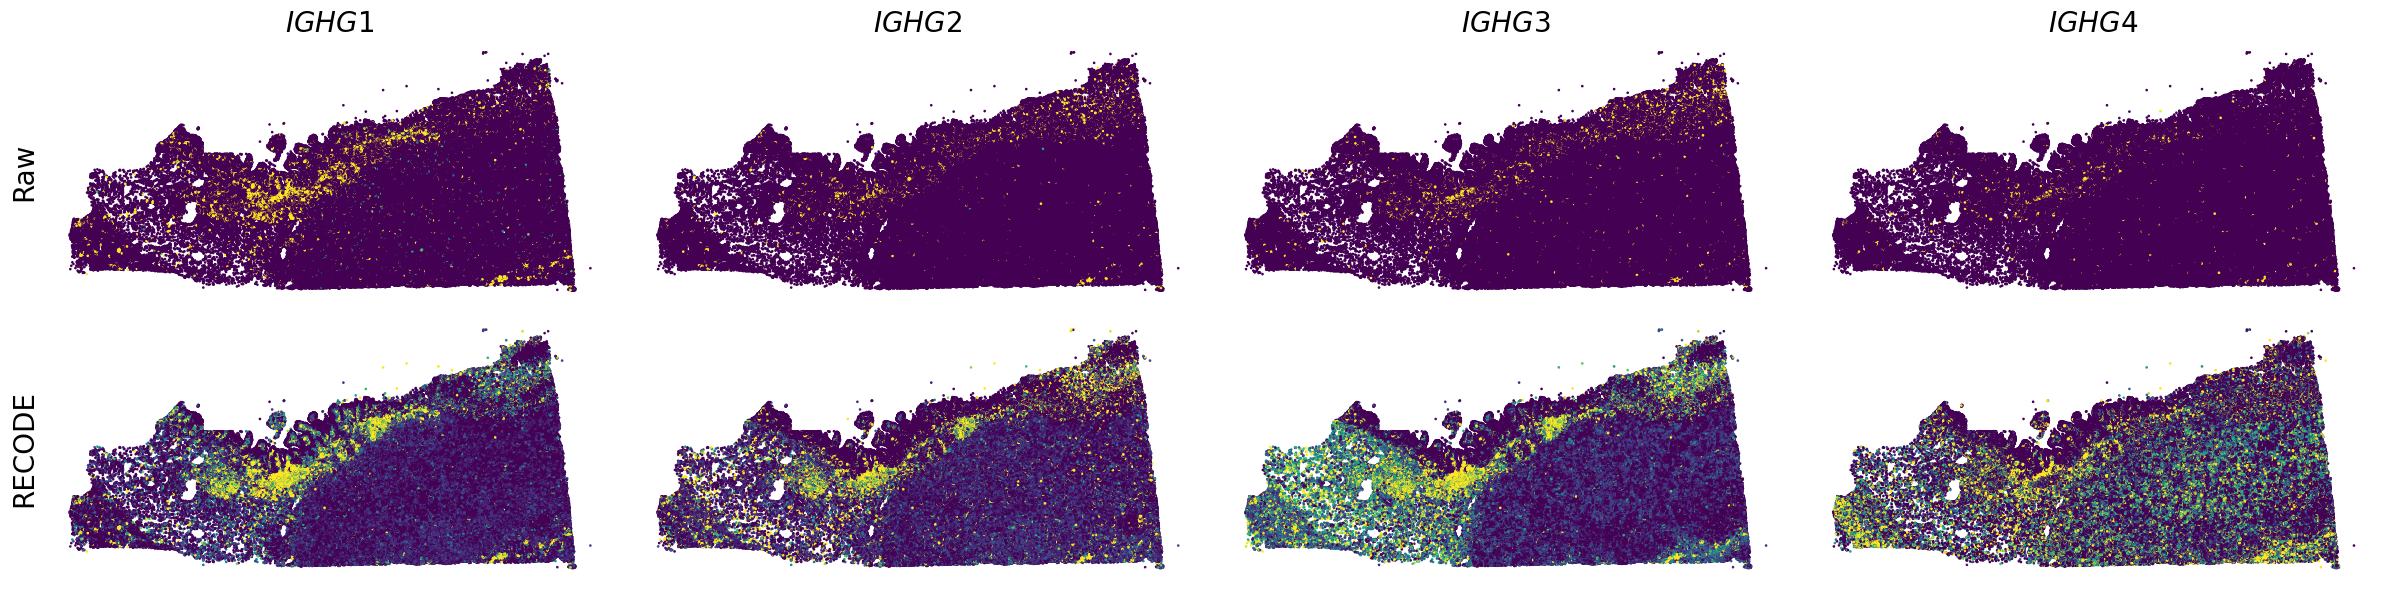
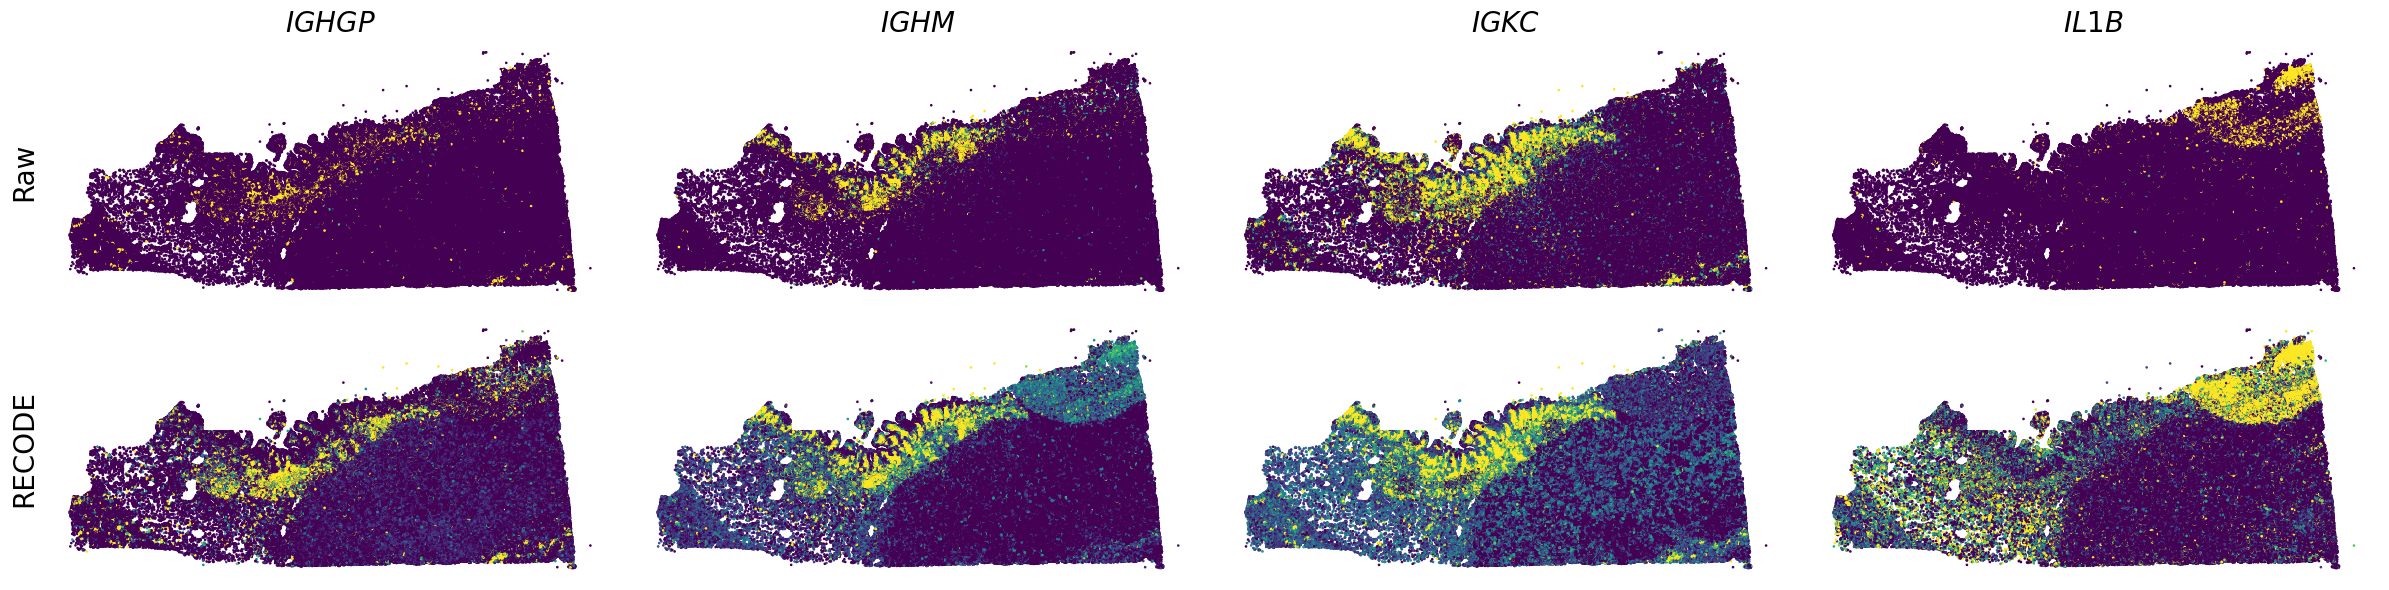
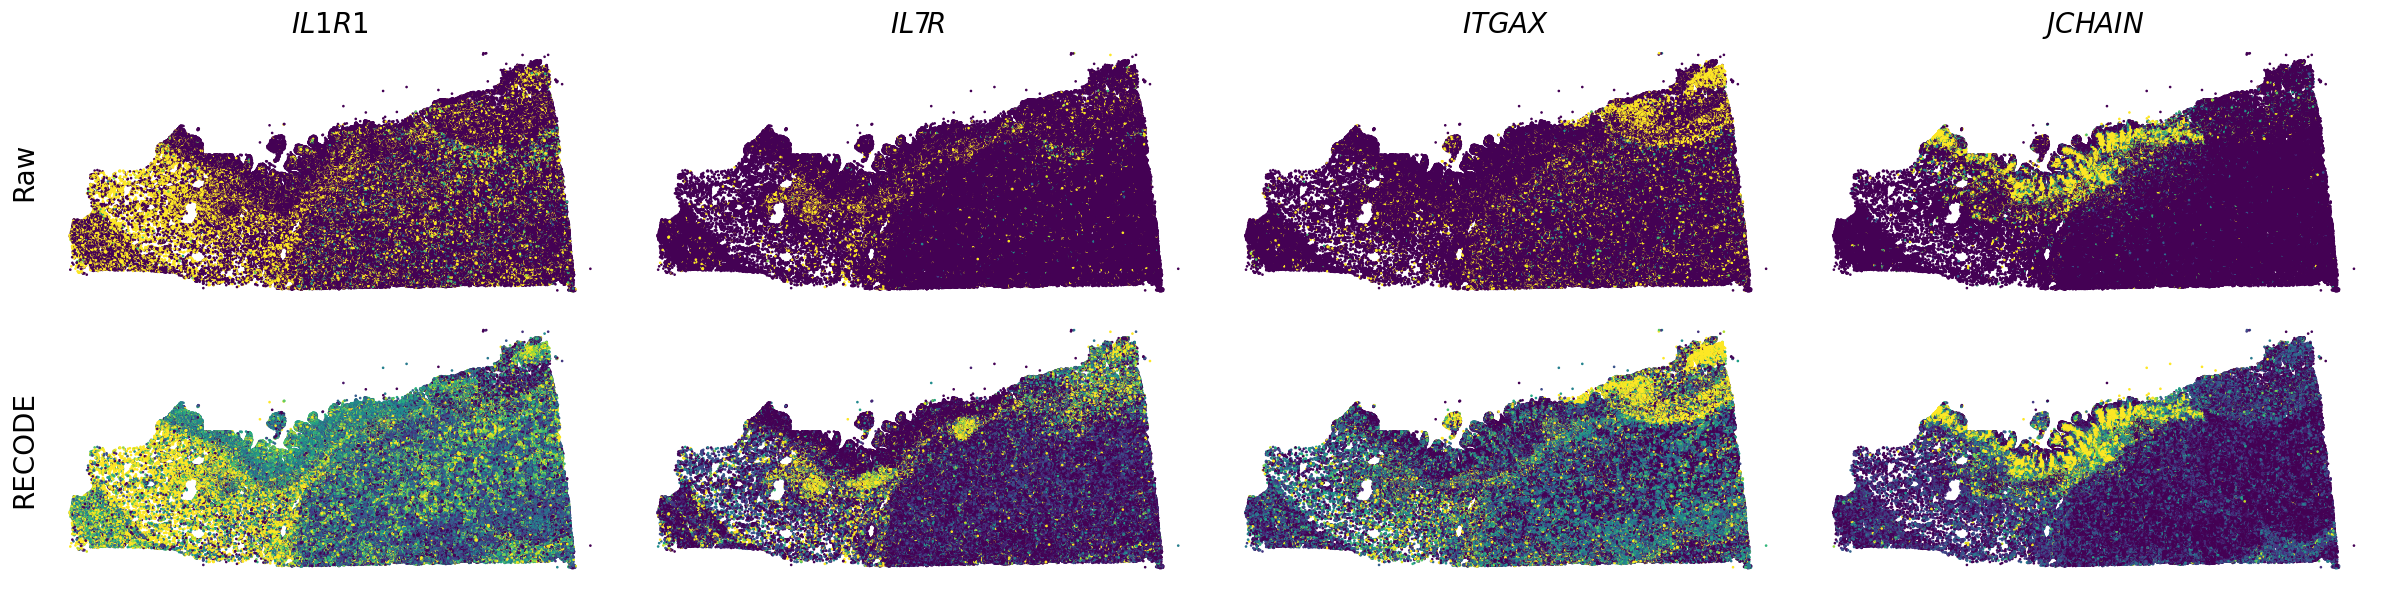
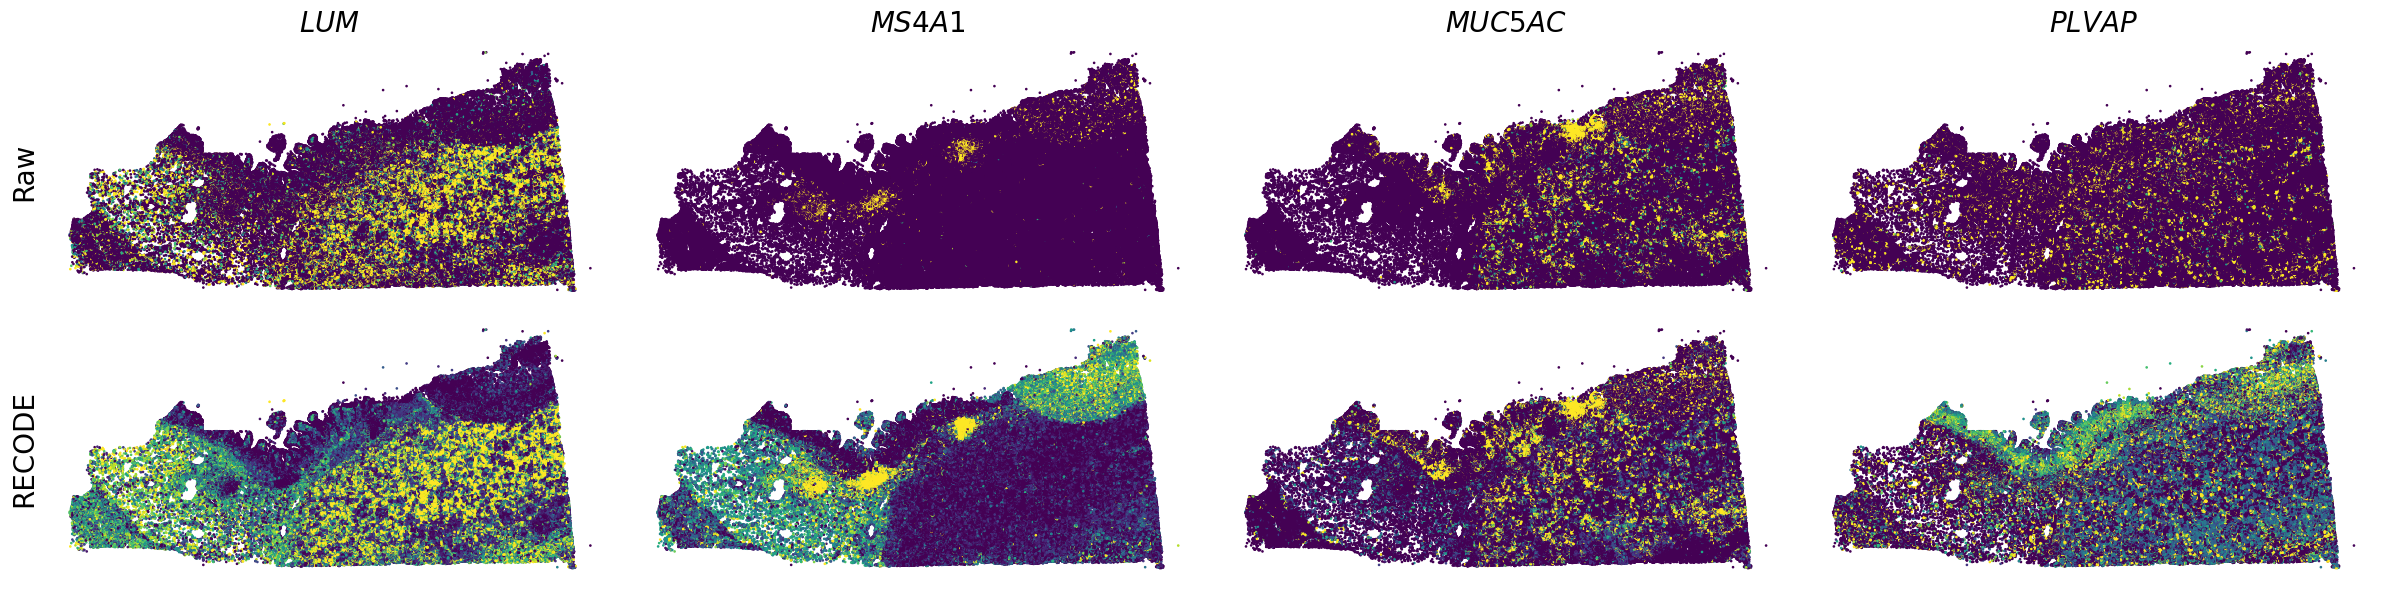
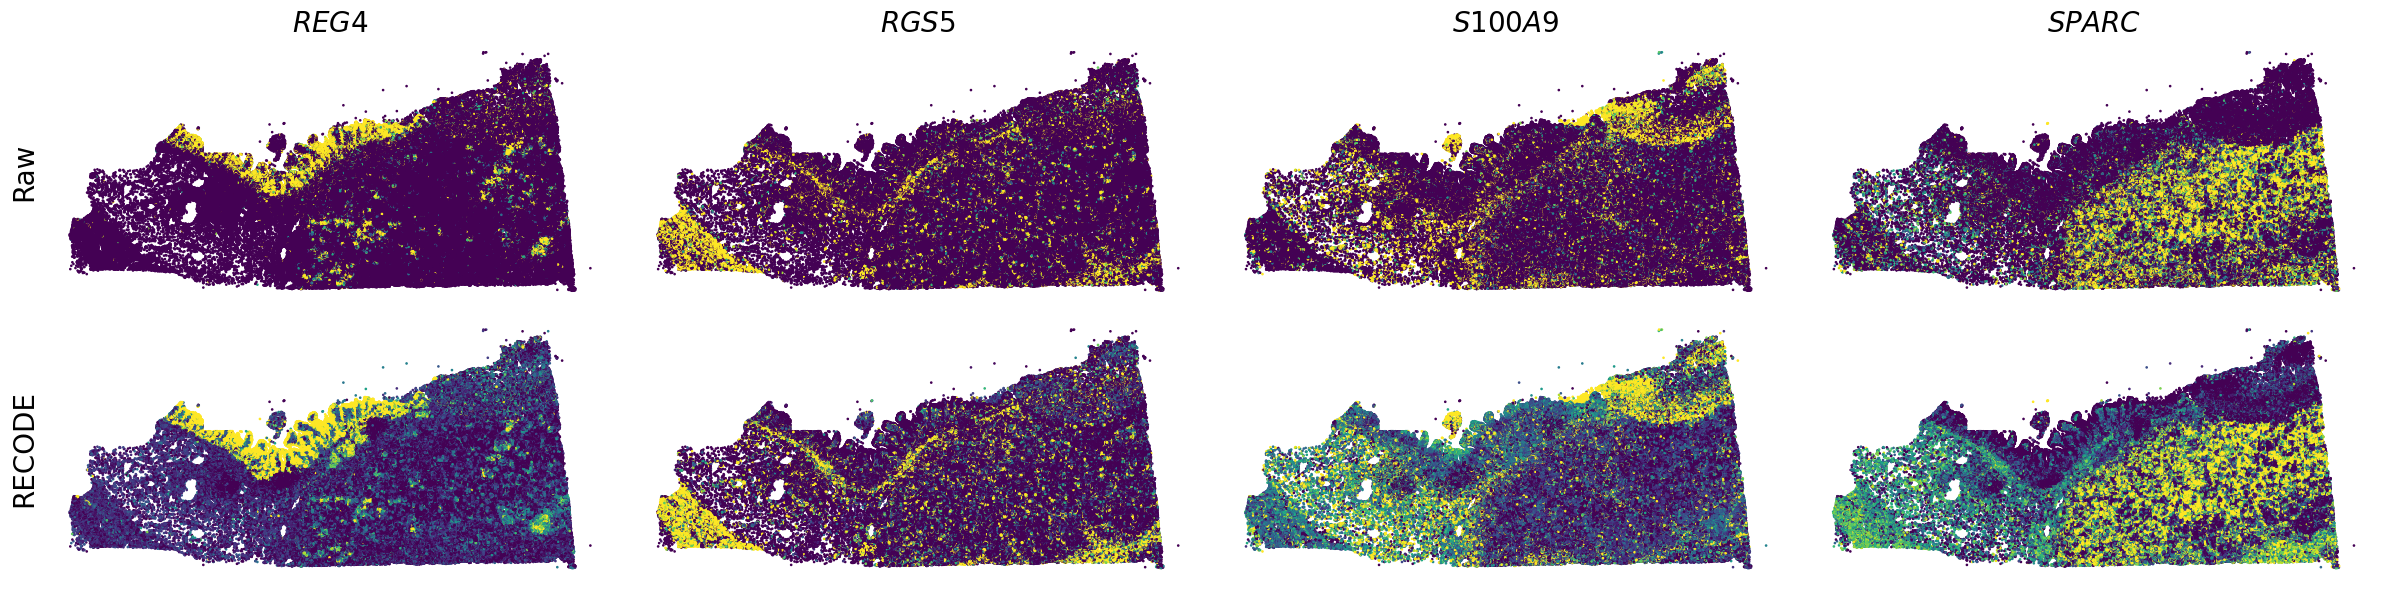
Plot spatial gene expression
[7]:
def spatial_gex(
        genes,
        sp_x,
        sp_y,
        psize = 1,
        figsize=(6,3),
        dpi=100,
        percentiles = [10,90],
        fs_title = 20,
        fs_label = 20,
    ):
    fig, ax = plt.subplots(2, len(genes), figsize=(figsize[0] * len(genes), figsize[1] * 2), tight_layout=True)

    for i, gene in enumerate(genes):
        idx_gene = adata.var.index == gene
        if idx_gene.sum() == 0:
            continue

        exp = adata.layers["RECODE_log"][:, idx_gene].flatten()  # 1次元に変換
        vmin, vmax = np.percentile(exp, percentiles)

        if len(genes)>1: ax_ = ax[1, i]
        else: ax_ = ax[1]
        sc = ax_.scatter(sp_x, sp_y, c=exp, s=psize, marker="H", vmin=vmin, vmax=vmax)
        plt.colorbar(sc, ax=ax_, fraction=0.05)

        if i == 0:
            ax_.set_ylabel("RECODE", fontsize=fs_label)
        ax_.axis('off')

        exp = adata.layers["Raw_log"][:, idx_gene].flatten()
        if len(genes)>1: ax_ = ax[0, i]
        else: ax_ = ax[0]
        sc = ax_.scatter(sp_x, sp_y, c=exp, s=psize, marker="H", vmin=vmin, vmax=vmax)
        plt.colorbar(sc, ax=ax_, fraction=0.05)

        ax_.set_title(f"$\\it{{{gene}}}$", fontsize=fs_title)
        if i == 0:
            ax_.set_ylabel("Raw", fontsize=fs_label)
        ax_.axis('off')

GENES = ["A2M", "ACTA2", "ACTB", "ANPEP", "APOE", "C1R", "C1S", "CD163", "CD44", "CD74", "CEACAM1", "CEACAM6", "CEACAM8", "CTSD", "CXCL1",
         "CXCL12", "CXCL13", "CXCL5", "DCN", "DMBT1", "EPCAM", "FCMR", "FLT1", "FN1", "G0S2", "IFITM3", "IFNGR1", "IGFBP7", "IGHG1", "IGHG2",
         "IGHG3", "IGHG4", "IGHGP", "IGHM", "IGKC", "IL1B", "IL1R1", "IL7R", "ITGAX", "JCHAIN", "LUM", "MS4A1", "MUC5AC", "PLVAP", "REG4", "RGS5",
         "S100A9", "SPARC", "SPARCL1", "TFF3", "TNFRSF13C", "VCAN"]

n_plots = 4
for i in range(int(len(GENES)/n_plots+0.9)):
    if (i+1)*n_plots < len(GENES):
        genes = GENES[i*n_plots:(i+1)*n_plots]
    else:
        genes = GENES[i*n_plots:len(GENES)]
    spatial_gex(genes,adata.obs["x_centroid"], -adata.obs["y_centroid"], figsize=(6,3))