Transcriptome (scRNA-seq data) + HVG selection
We show an example of scRNA-seq data produced by 10X Chromium. We are using scRNA-seq data 3k PBMCs from a Healthy Donor (2,700 cells and 32,738 genes) from 10X Genomics Datasets.
This analysis follow Preprocessing and clustering 3k PBMCs in Scanpy tutorials except for RECODE processing.
We use scanpy to read/write 10X data. Import numpy and scanpy in addlition to screcode.
[1]:
import screcode
import numpy as np
import scanpy as sc
import pandas as pd
import warnings
warnings.simplefilter('ignore')
Read in the count matrix into an AnnData object.
[2]:
adata = sc.read_10x_mtx(
    "data/pbmc3k_filtered_gene_bc_matrices/filtered_gene_bc_matrices/hg19/",  # the directory with the `.mtx` file
    var_names="gene_symbols",  # use gene symbols for the variable names (variables-axis index)
    cache=True,  # write a cache file for faster subsequent reading
)
adata.var_names_make_unique()
adata.layers["Raw"] = np.array(adata.X.toarray(),dtype=int)
adata
[2]:
AnnData object with n_obs × n_vars = 2700 × 32738
    var: 'gene_ids'
    layers: 'Raw'
Apply RECODE
Apply RECODE to the count matrix. The anndata or ndarray data format is available.
[9]:
recode = screcode.RECODE()
adata = recode.fit_transform(adata)
start RECODE for scRNA-seq data
RECODE-denoised data are stored as "RECODE" in adata.layers
Normalized data are stored as "RECODE_norm" and "RECODE_log" in adata.layers
end RECODE for scRNA-seq
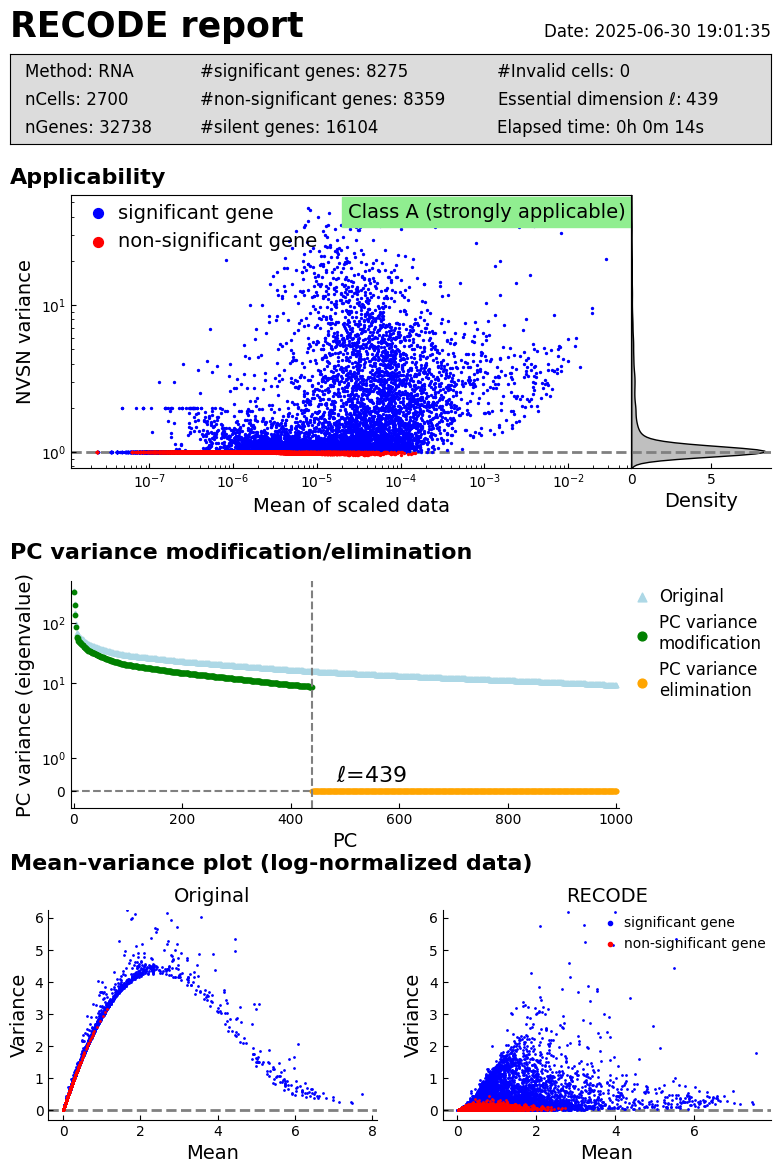
log: {'seq_target': 'RNA', '#significant genes': 8275, '#non-significant genes': 8359, '#silent genes': 16104, 'ell': 439, 'Elapsed time': '0h 0m 14s 226ms', 'solver': 'full'}
Performance check
[10]:
recode.report()
Highly variable gene selection using RECODE
[11]:
recode.highly_variable_genes(adata)
adata
Highly variable genes are stored in adata.var['RECODE_highly_variable']
[11]:
AnnData object with n_obs × n_vars = 2700 × 32738
    var: 'gene_ids', 'RECODE_noise_variance', 'RECODE_NVSN_variance', 'RECODE_significance', 'RECODE_denoised_variance', 'RECODE_means', 'RECODE_highly_variable'
    uns: 'RECODE_essential'
    layers: 'Raw', 'RECODE', 'RECODE_NVSN', 'RECODE_norm', 'RECODE_log'
[12]:
## Compare with other methods
n_top_genes = 2000
flavor = 'seurat'
target_sum = 1e4
adata_ = adata.copy()
adata_.X = adata.layers["Raw"]
sc.pp.normalize_total(adata_, target_sum=target_sum)
sc.pp.log1p(adata_)
sc.pp.highly_variable_genes(adata_, flavor=flavor, n_top_genes=n_top_genes)
adata.var[f"{flavor}_means"] = adata_.var["means"]
adata.var[f"{flavor}_dispersions"] = adata_.var["dispersions"]
adata.var[f"{flavor}_dispersions_norm"] = adata_.var["dispersions_norm"]
flavor = 'seurat_v3'
adata_ = adata.copy()
adata_.X = adata.layers["Raw"]
sc.pp.highly_variable_genes(adata_, flavor=flavor, n_top_genes=n_top_genes)
adata.var[f"{flavor}_variances"] = adata_.var["variances"]
adata.var[f"{flavor}_variances_norm"] = adata_.var["variances_norm"]
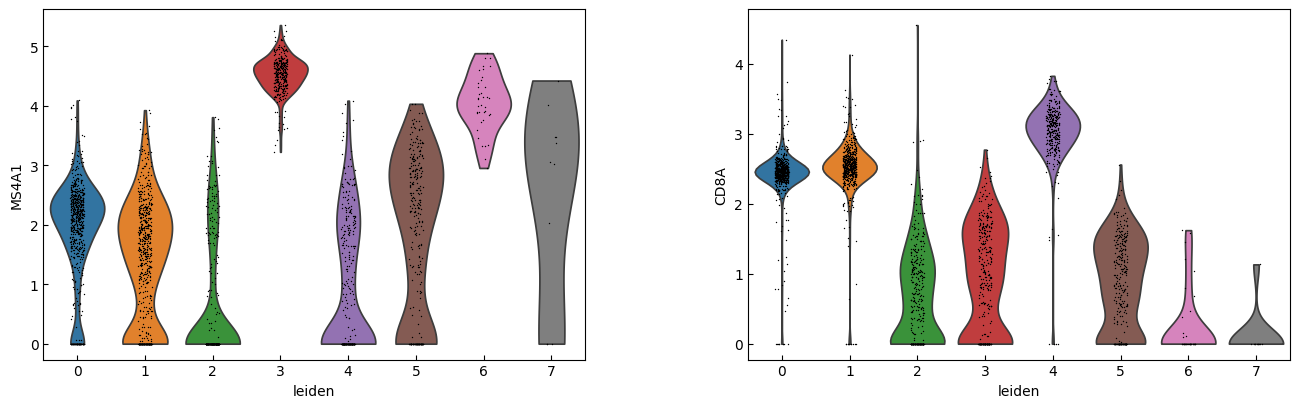
marker_genes = ['IL7R', 'CD79A', 'MS4A1', 'CD8A', 'CD8B', 'LYZ', 'CD14',
'LGALS3', 'S100A8', 'GNLY', 'NKG7', 'KLRB1',
'FCGR3A', 'MS4A7', 'FCER1A', 'CST3', 'PPBP']
adata.var['HVG_rank_Seurat'] = adata.var['seurat_dispersions_norm'].rank(ascending=False, method='min')
adata.var['HVG_rank_Seurat_v3'] = adata.var['seurat_v3_variances_norm'].rank(ascending=False, method='min')
adata.var['HVG_rank_RECODE'] = adata.var['RECODE_denoised_variance'].rank(ascending=False, method='min')
hvg_ranks = adata.var.loc[marker_genes, ['HVG_rank_Seurat', 'HVG_rank_Seurat_v3', 'HVG_rank_RECODE']]
hvg_ranks = hvg_ranks.astype(int)
hvg_ranks
[12]:
| HVG_rank_Seurat | HVG_rank_Seurat_v3 | HVG_rank_RECODE | |
|---|---|---|---|
| IL7R | 2545 | 2056 | 68 |
| CD79A | 786 | 55 | 22 |
| MS4A1 | 2199 | 580 | 77 |
| CD8A | 8106 | 9970 | 547 |
| CD8B | 3157 | 2218 | 224 |
| LYZ | 274 | 2 | 3 |
| CD14 | 4424 | 2041 | 72 |
| LGALS3 | 1304 | 1082 | 34 |
| S100A8 | 485 | 12 | 2 |
| GNLY | 218 | 5 | 6 |
| NKG7 | 562 | 16 | 4 |
| KLRB1 | 1328 | 582 | 1195 |
| FCGR3A | 1941 | 85 | 28 |
| MS4A7 | 3431 | 359 | 158 |
| FCER1A | 381 | 10 | 514 |
| CST3 | 1051 | 18 | 5 |
| PPBP | 66 | 1 | 30 |
[13]:
adata.X = adata.layers["RECODE_log"]
adata = adata[:, adata.var.RECODE_highly_variable]
adata
[13]:
View of AnnData object with n_obs × n_vars = 2700 × 2000
    var: 'gene_ids', 'RECODE_noise_variance', 'RECODE_NVSN_variance', 'RECODE_significance', 'RECODE_denoised_variance', 'RECODE_means', 'RECODE_highly_variable', 'seurat_means', 'seurat_dispersions', 'seurat_dispersions_norm', 'seurat_v3_variances', 'seurat_v3_variances_norm', 'HVG_rank_Seurat', 'HVG_rank_Seurat_v3', 'HVG_rank_RECODE'
    uns: 'RECODE_essential'
    layers: 'Raw', 'RECODE', 'RECODE_NVSN', 'RECODE_norm', 'RECODE_log'
Downstream analysis based on scanpy
PCA
[14]:
n_comps = 1000
sc.tl.pca(adata, svd_solver='arpack',n_comps=n_comps)
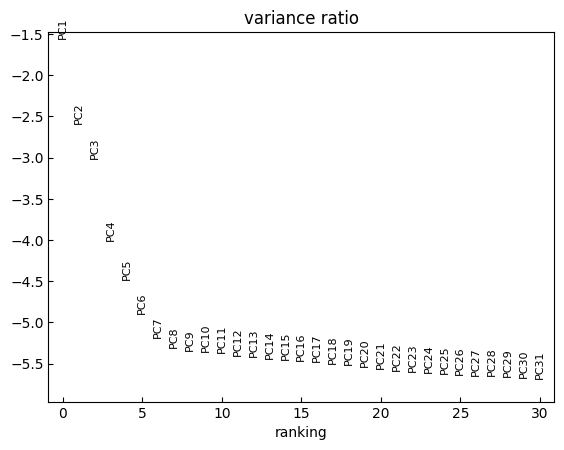
[15]:
sc.pl.pca_variance_ratio(adata, log=True)
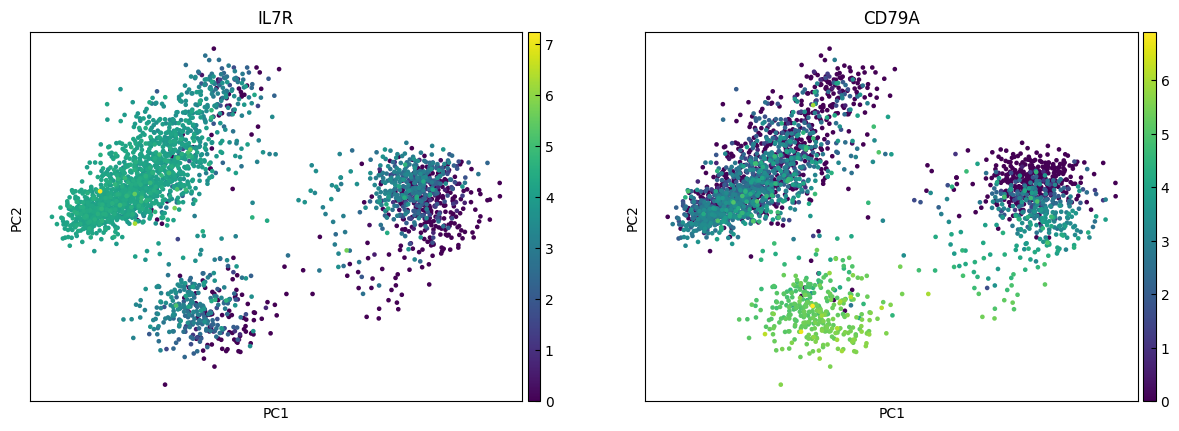
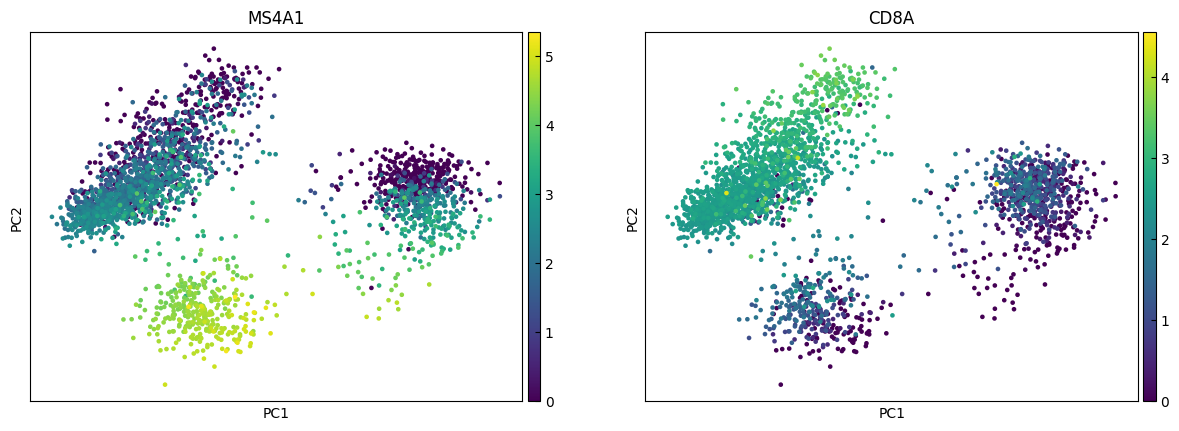
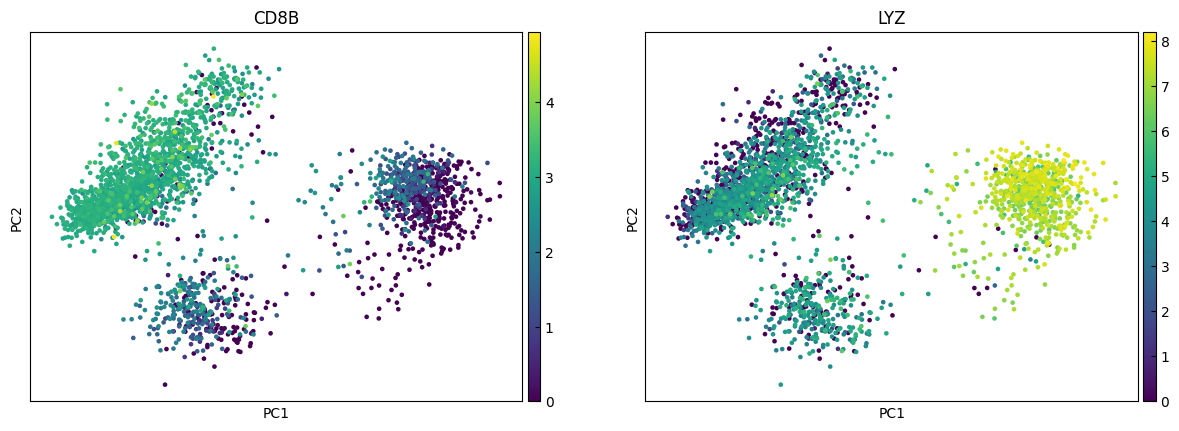
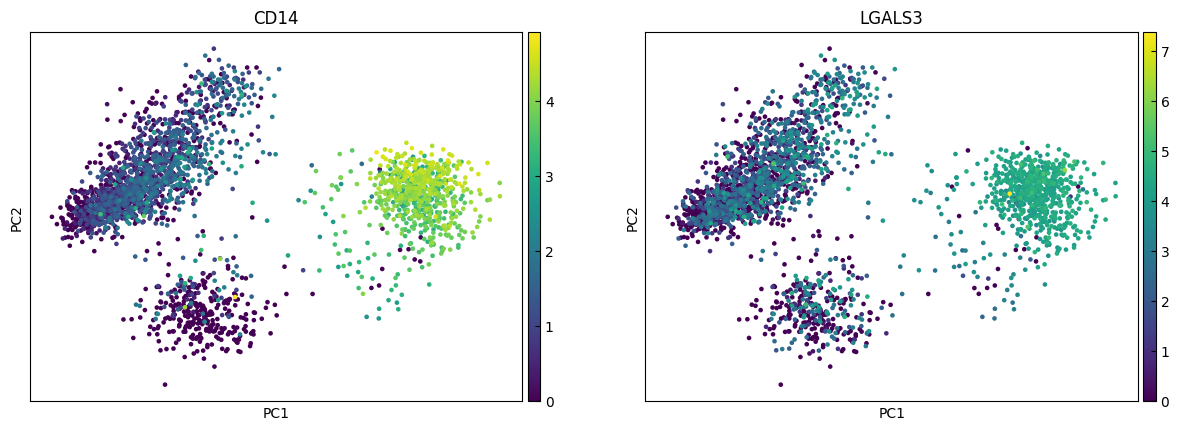
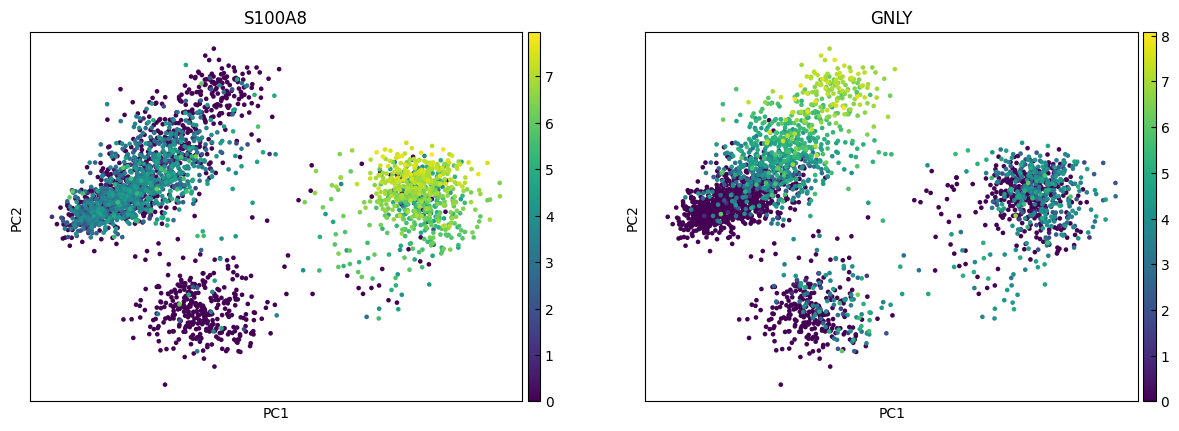
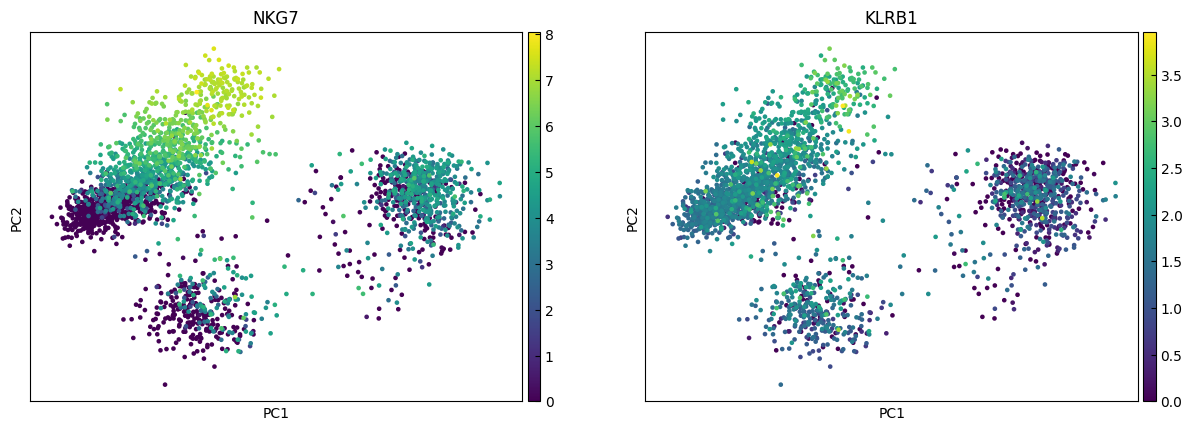
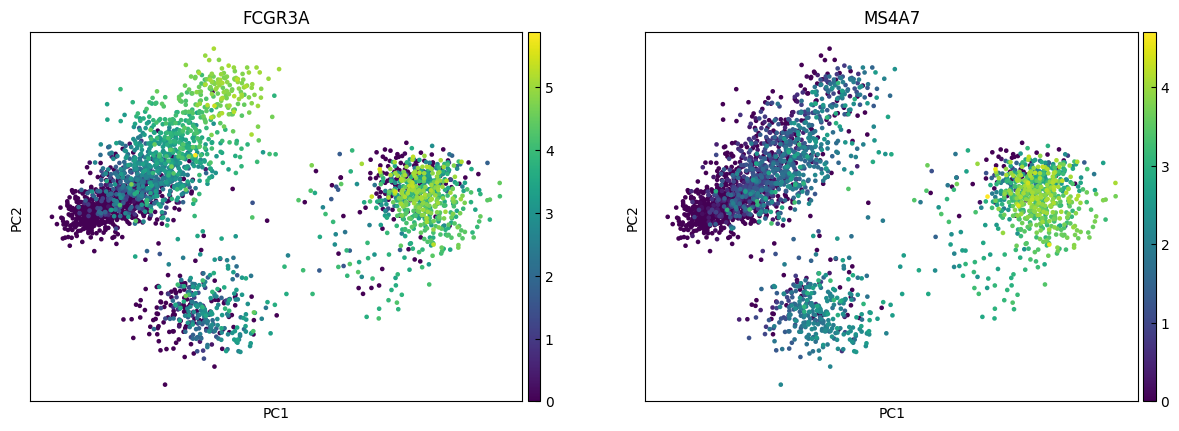
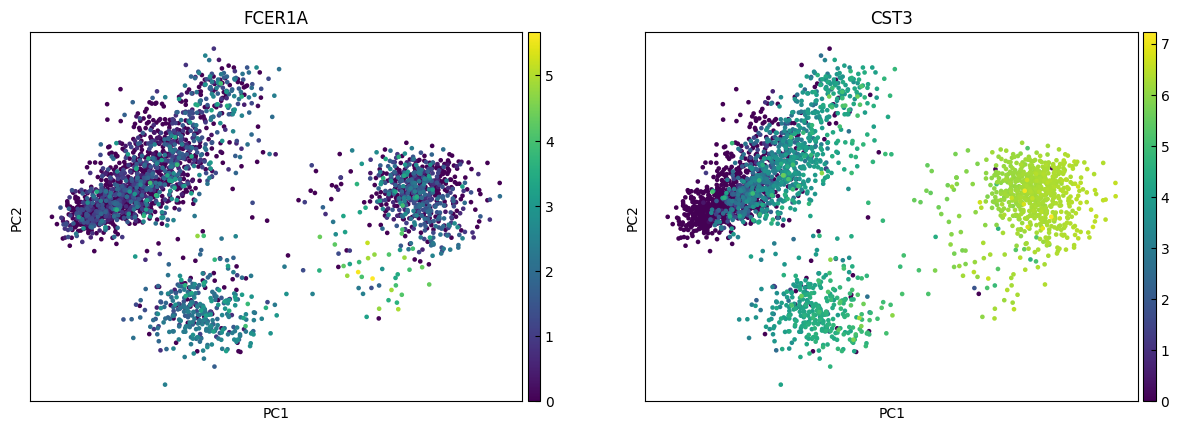
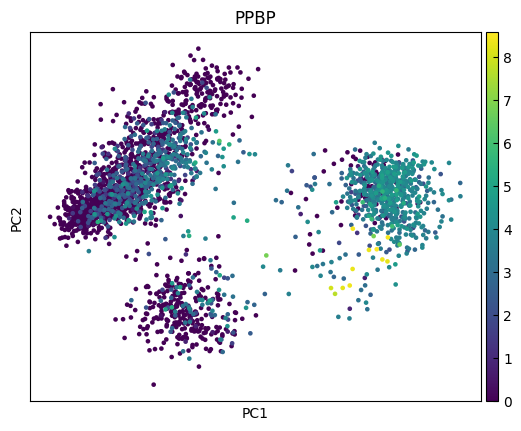
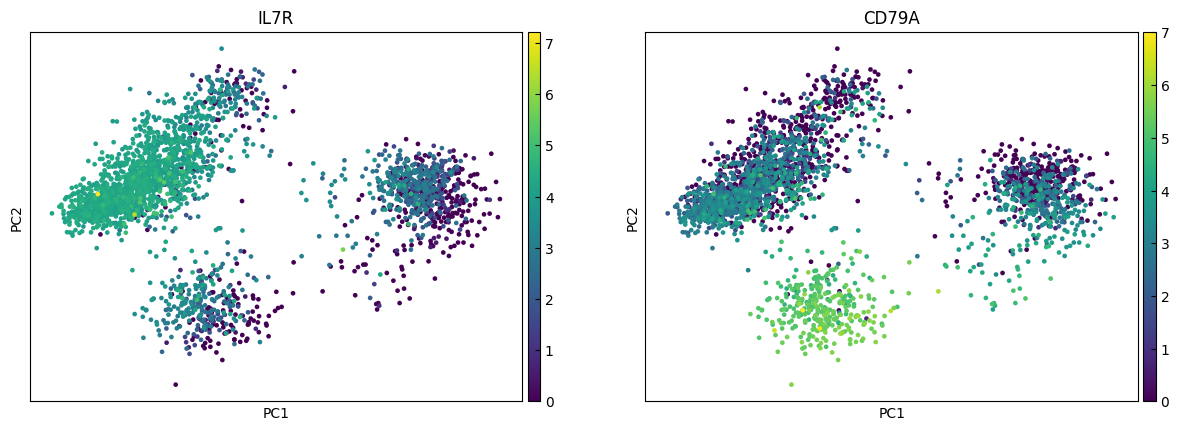
[16]:
n_cols = 2
for i in range(0, len(marker_genes),n_cols):
    sc.pl.pca(adata, color=marker_genes[i:i+n_cols])
UMAP
Note that we do not use the PCA dimentionaly reduction as a preprocessing of UMAP (n_pca=0).
[17]:
sc.pp.neighbors(adata, n_pcs=100)
sc.tl.umap(adata)
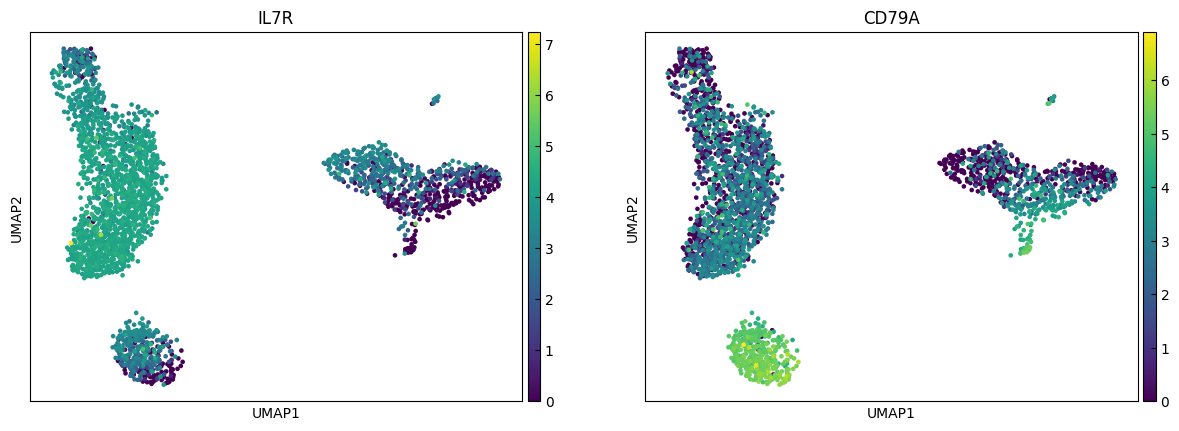
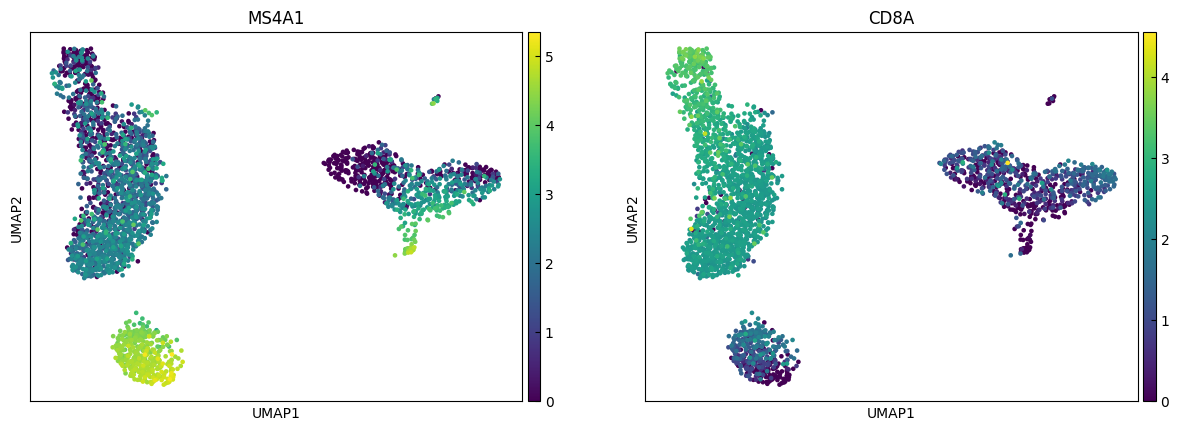
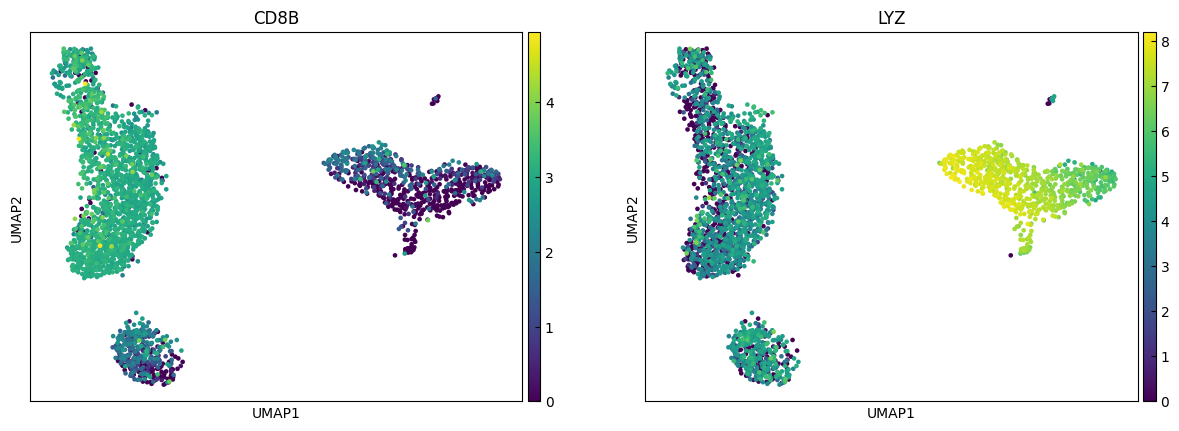
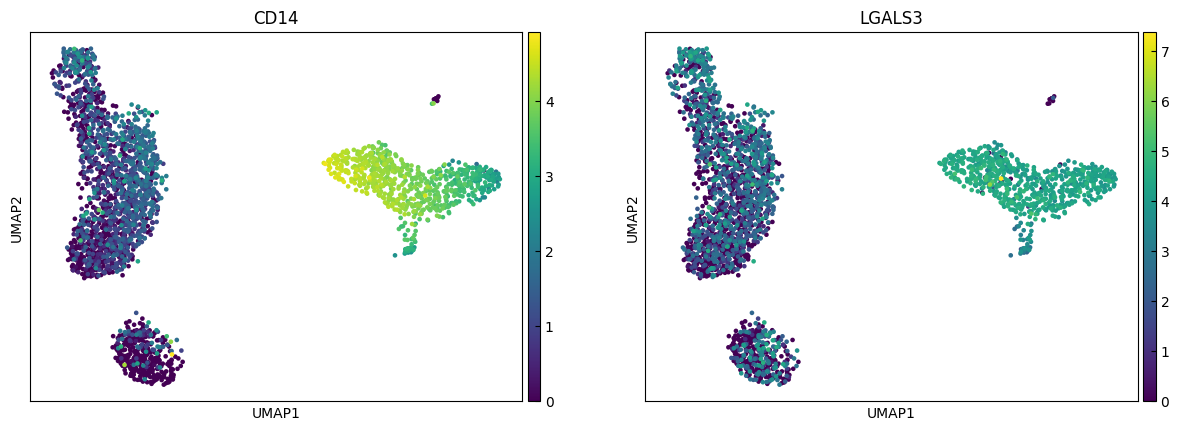
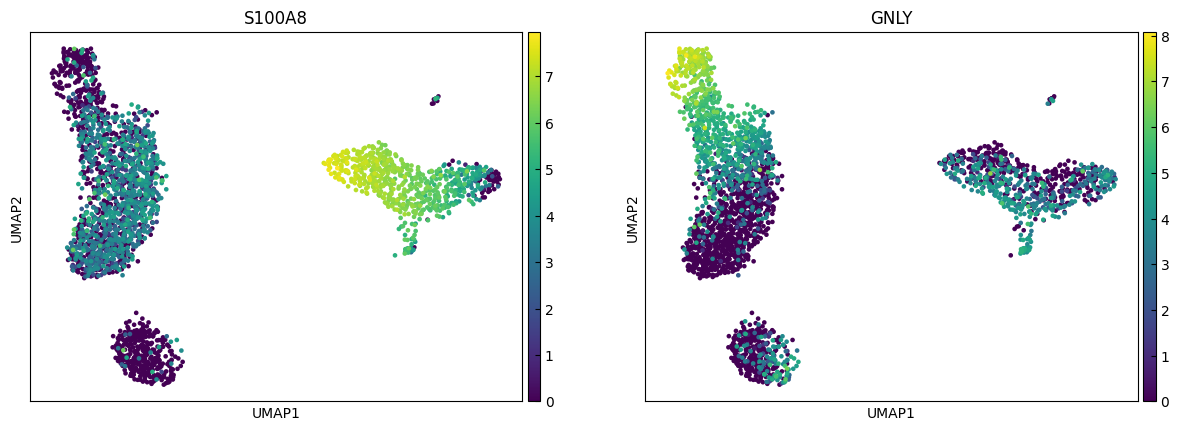
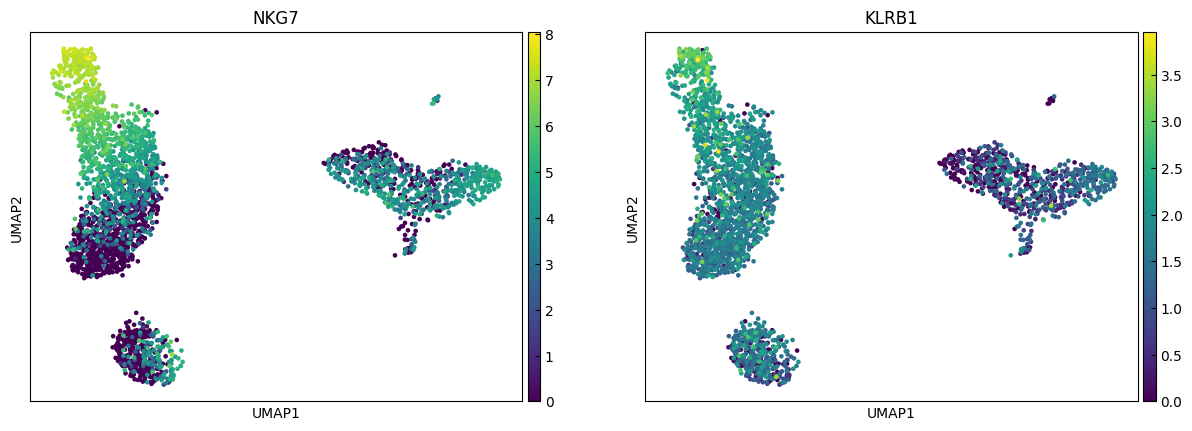
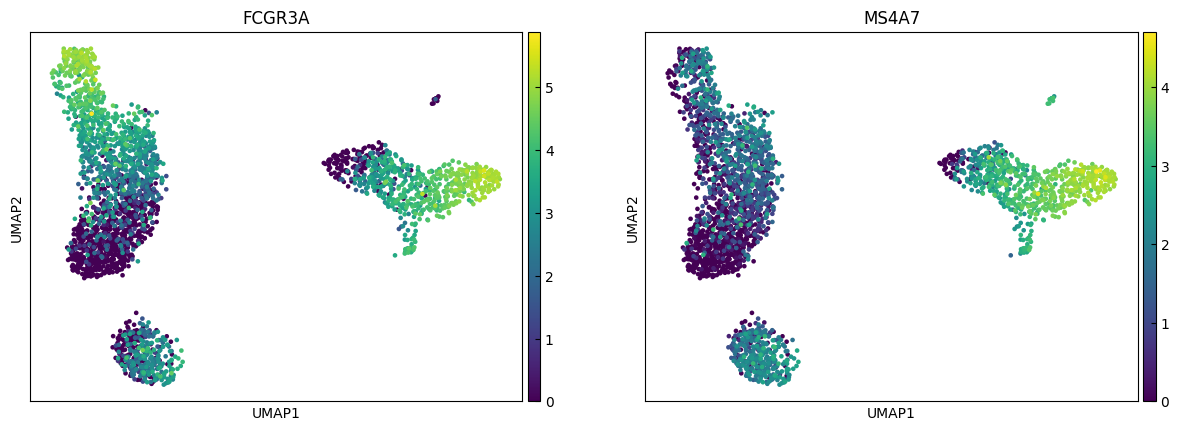
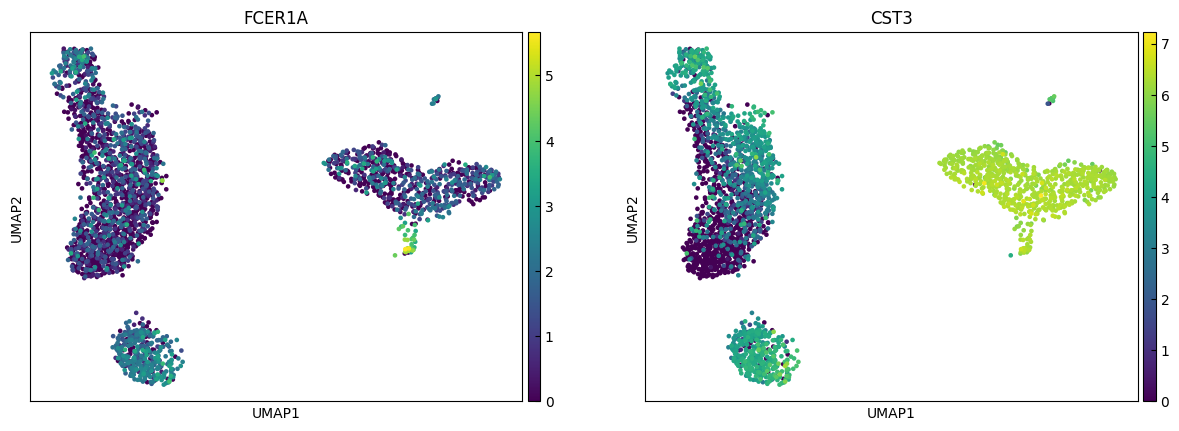
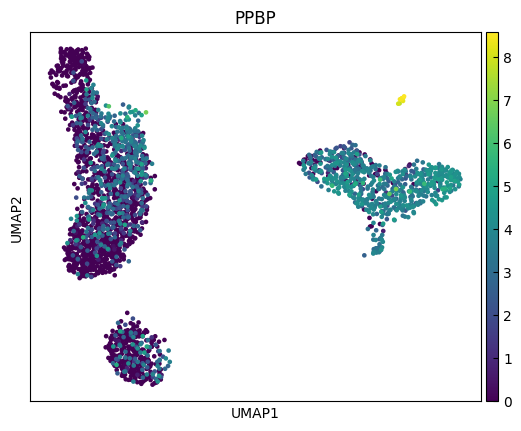
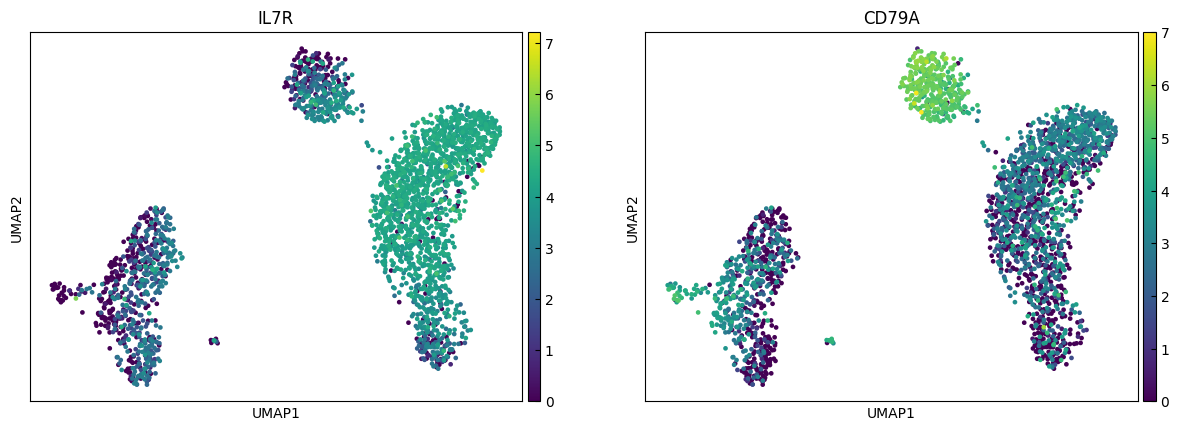
[18]:
n_cols = 2
for i in range(0, len(marker_genes),n_cols):
    sc.pl.umap(adata, color=marker_genes[i:i+n_cols])
Clustering
[19]:
# pip install igraph leidenalg
[20]:
sc.tl.leiden(adata,resolution=0.9)
if 'leiden_colors' in adata.uns:
    del adata.uns['leiden_colors']
sc.pl.umap(adata, color=['leiden'],legend_loc='on data')
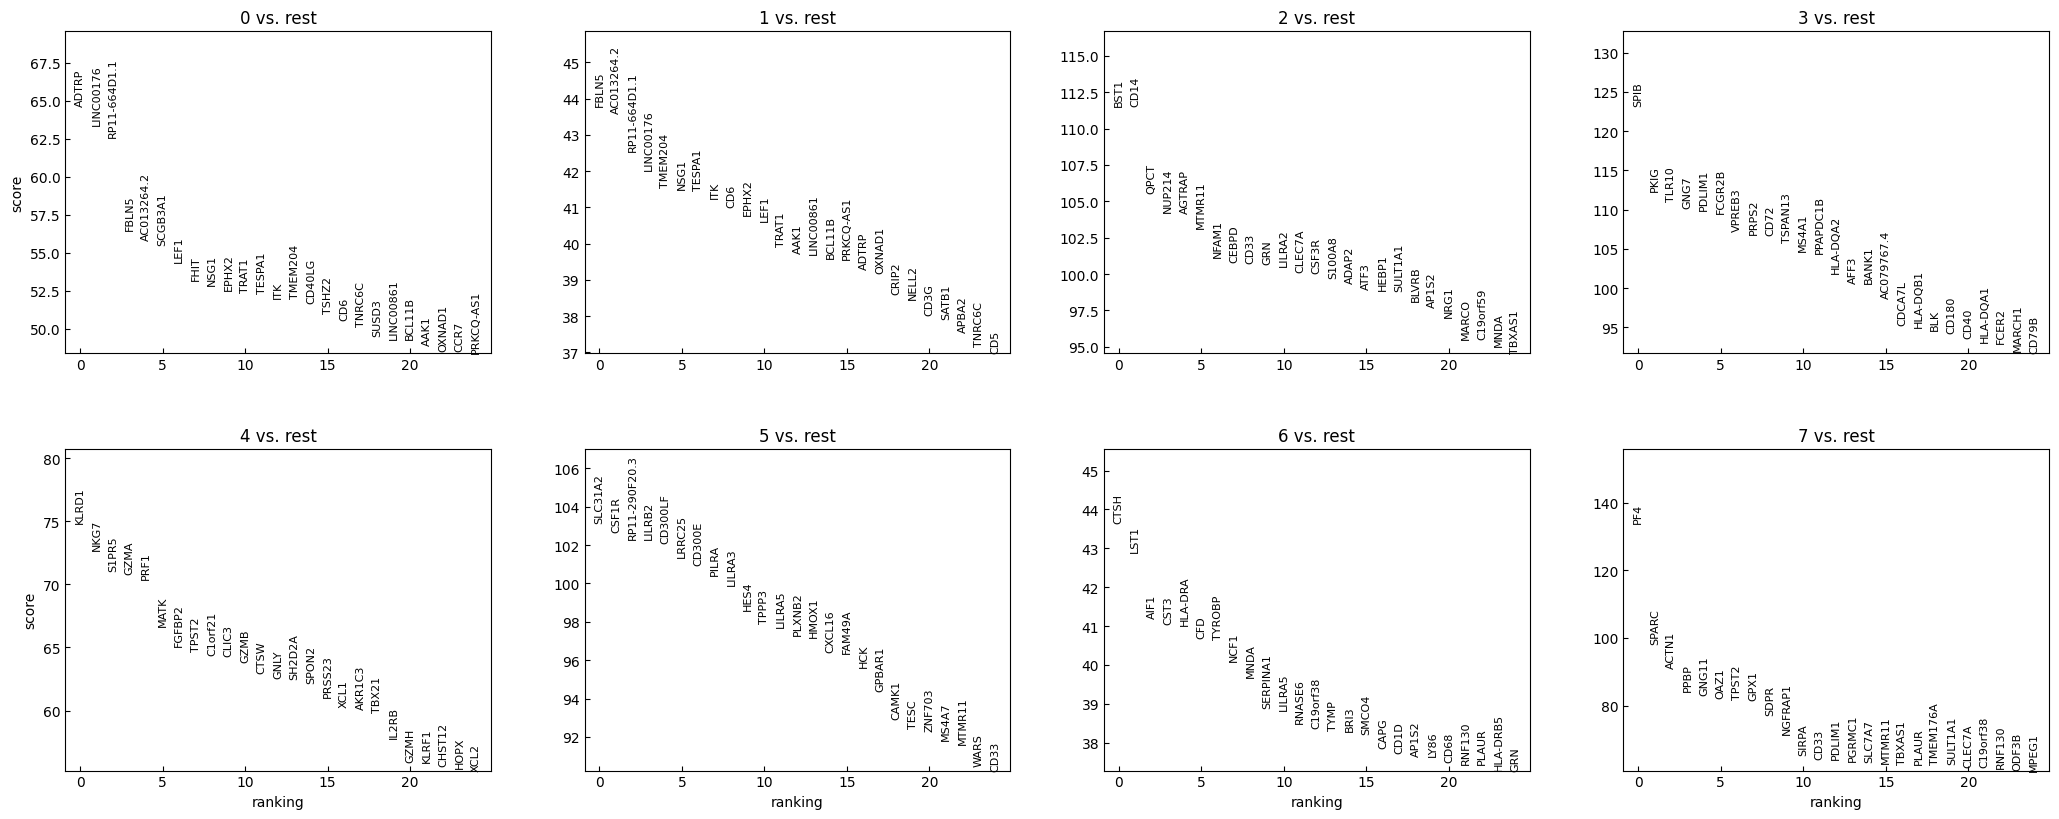
Finding marker genes
[21]:
sc.tl.rank_genes_groups(adata, "leiden", method="t-test")
sc.pl.rank_genes_groups(adata, n_genes=25, sharey=False)
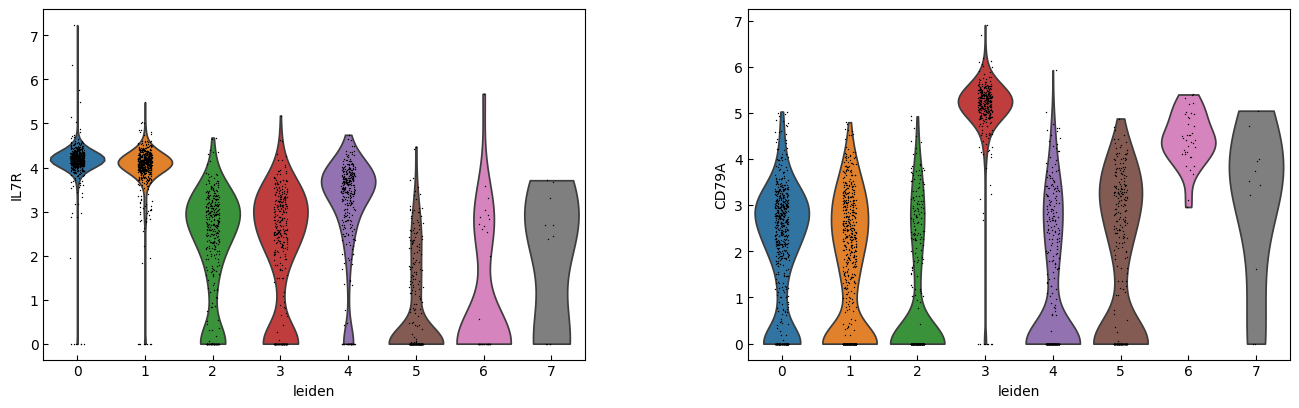
[22]:
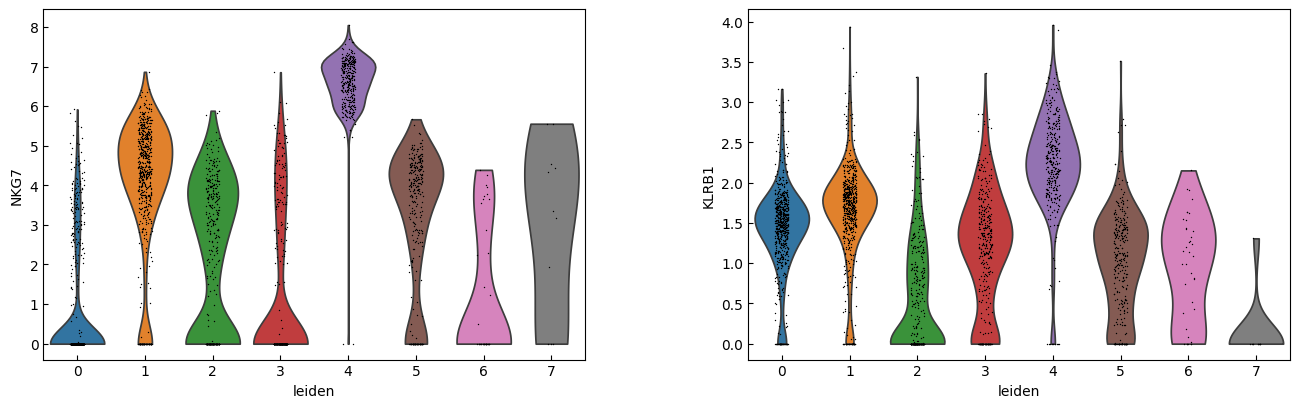
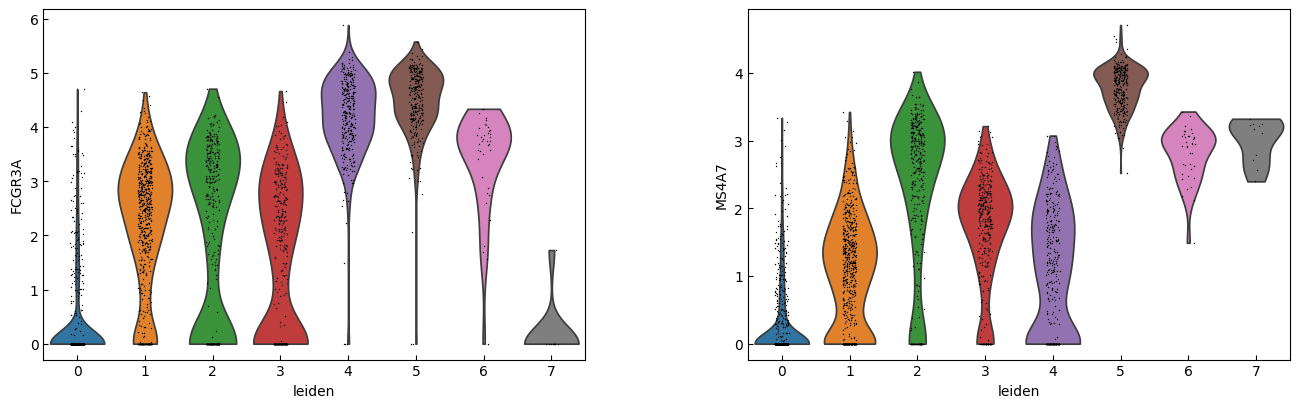
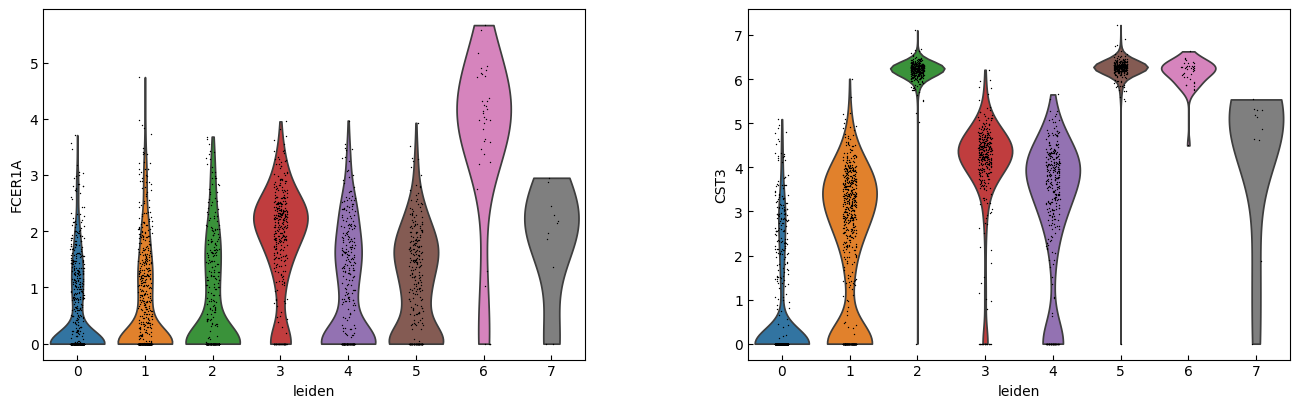
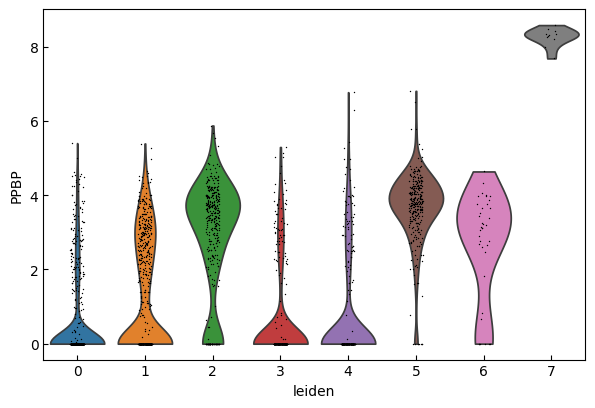
adata.var_names_make_unique()
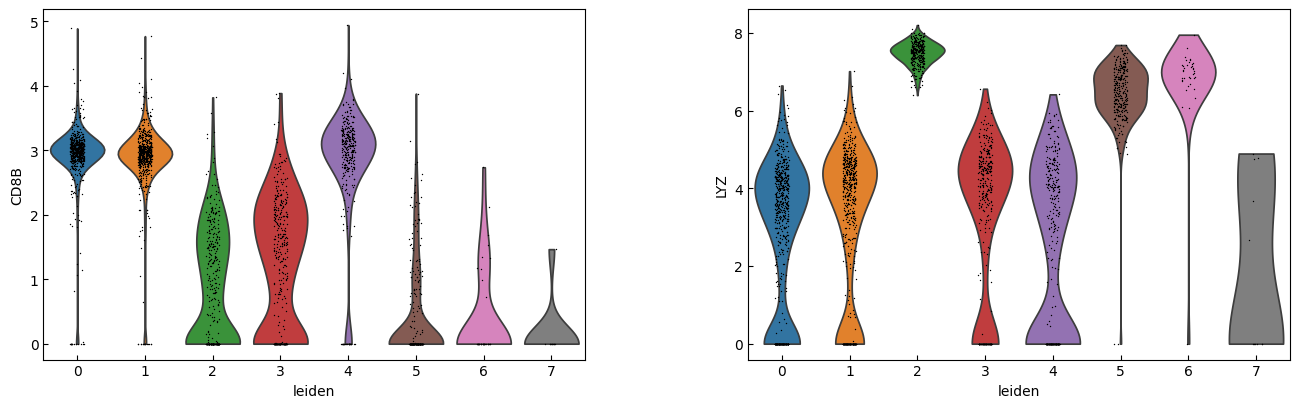
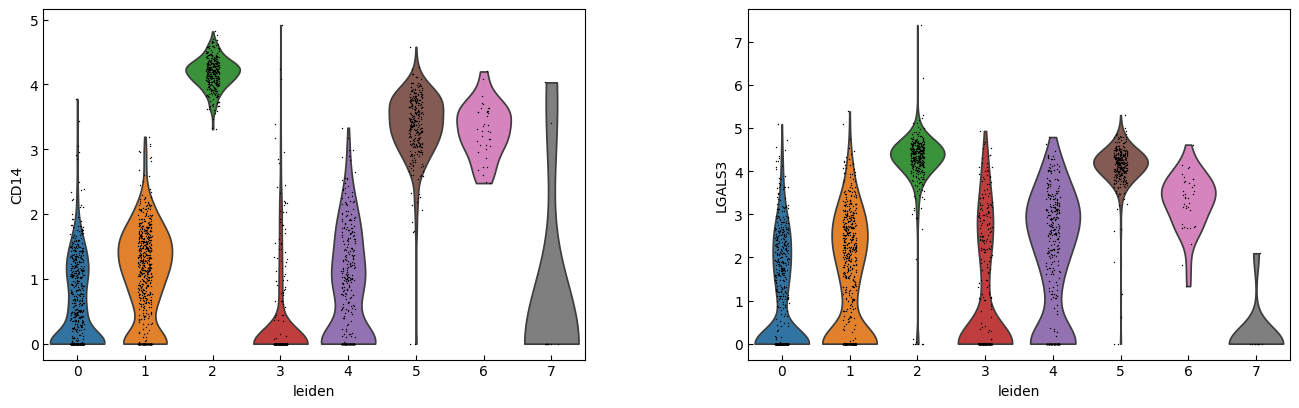
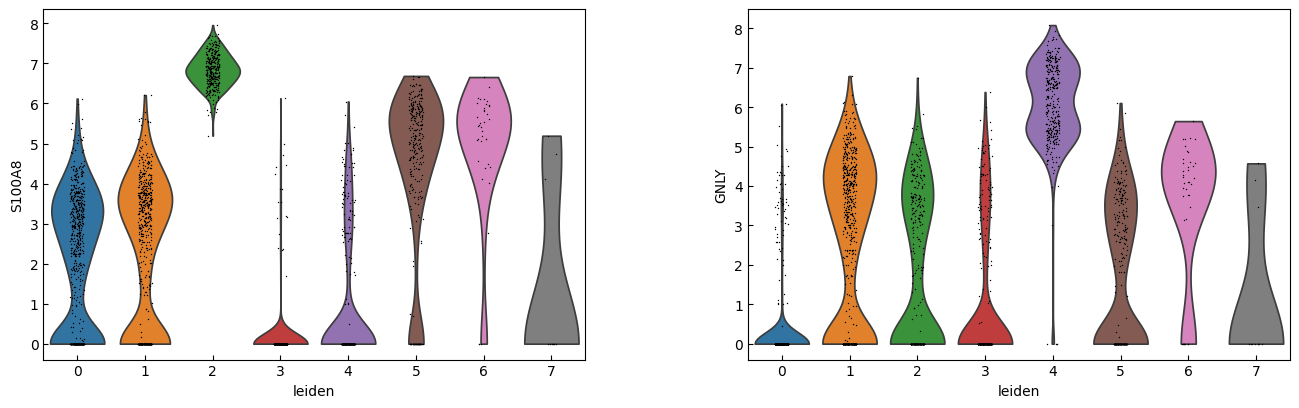
n_cols = 2
for i in range(0, len(marker_genes),n_cols):
sc.pl.violin(adata, marker_genes[i:i+n_cols], groupby='leiden')
[23]:
sc.pl.dotplot(adata, marker_genes, groupby="leiden",expression_cutoff=3)
[24]:
cell_types = [
"CD4 T", # Cluster 0: high IL7R expression → CD4 T cells
"CD4 T", # Cluster 1: IL7R expression suggests another CD4 T cell
"CD14+ Monocytes", # Cluster 2: high LYZ, CD14, S100A8 → CD14+ Monocytes
"B", # Cluster 3: high CD79A, MS4A1 → B cells
"CD8 T", # Cluster 4: high IL7R, NKG7 → CD8 T cells
"FCGR3A+ Monocytes", # Cluster 5: expression of FCGR3A, MS4A7 (and some CD14) → FCGR3A+ monocytes
"NK", # Cluster 6: high GNLY, NKG7 → NK cells
"Dendritic", # Cluster 7: elevated FCER1A, CST3 → dendritic cells
"Megakaryocytes", # Cluster 8: high PPBP expression → megakaryocyte cells
]
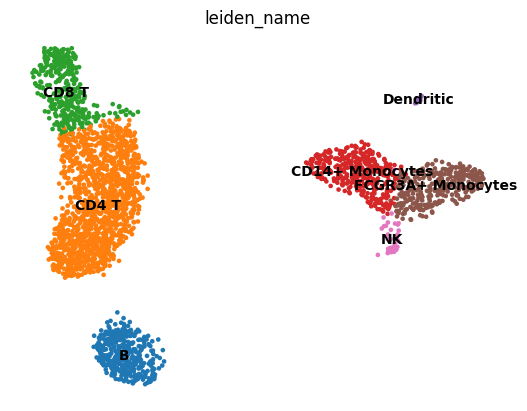
adata.obs["leiden_name"] = [cell_types[int(i)] for i in adata.obs["leiden"].values]
if 'leiden_name_colors' in adata.uns:
del adata.uns['leiden_name_colors']
sc.pl.umap(adata, color='leiden_name', legend_loc='on data', frameon=False)